Swing trading set ups
1. Pin bar at 200EMA in daily TF
2. Stocks riding through upper Bollinger Band in daily TF
3. Hidden bullish divergence
4. Price at horizontal channel bottom
5. Anchor vwap support from past major swing low
6. Price retesting previous ATH after breakout
More from Aneesh Philomina Antony (ProdigalTrader)
#tataelxsi
2772 - 4455
60% move
it made a fresh breakout recently and looks poised to make further gains
strong stock for huge gains https://t.co/bTizotDqHz
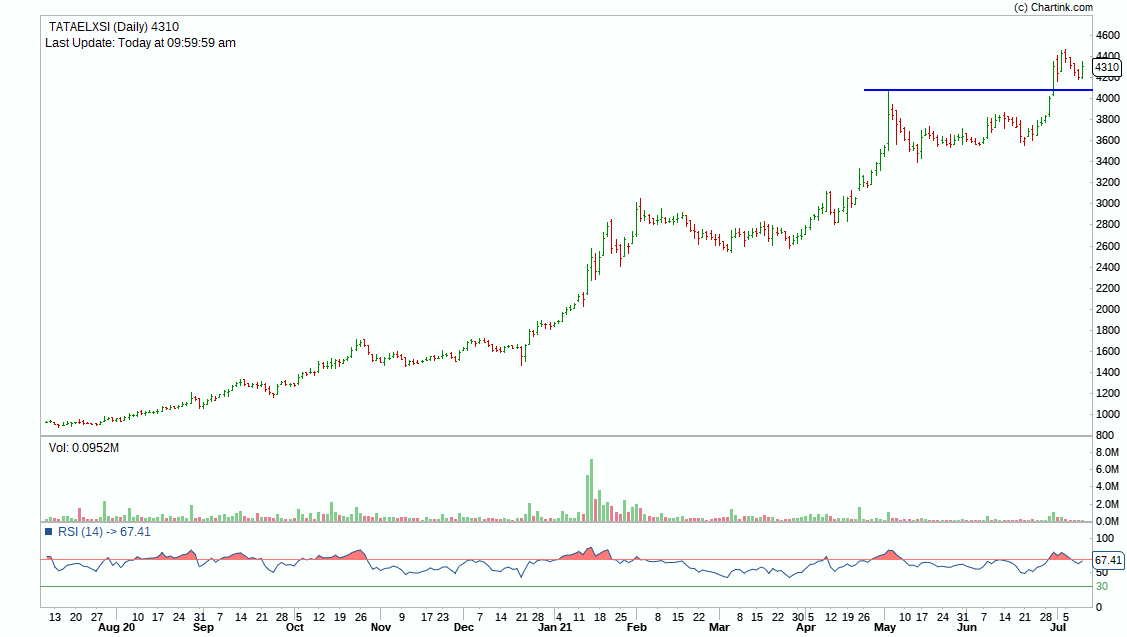
2772 - 4455
60% move
it made a fresh breakout recently and looks poised to make further gains
strong stock for huge gains https://t.co/bTizotDqHz
strong uptrending stock
— Aneesh Philomina Antony (@ProdigalTrader) April 4, 2021
unlikely to accumulate for further long
supply seems to have dried up#tataelxsi pic.twitter.com/btBiDgfxbt
1.
Start fibo retracement from swing high, not the other way around. Simply 0 point should b where retracement started
2.
The base should b chosen as major swing low. Can't just pick a random point
Start fibo retracement from swing high, not the other way around. Simply 0 point should b where retracement started
2.
The base should b chosen as major swing low. Can't just pick a random point
Similar views (shared Yesterday) Aneesh Bhai\U0001f447https://t.co/UxJZFdWJxh
— Bharat Sahni (@NiveshakBharat) September 29, 2021
I have explained the importance of meeasuring momentum of the trend.
U can guage the strength in the trend once u know how to measure the direction.
This trend strength is infact signals the trend continuity or the potetnial for sustanining the trend.
Thats great assurace to hav https://t.co/HanLvlXkjQ
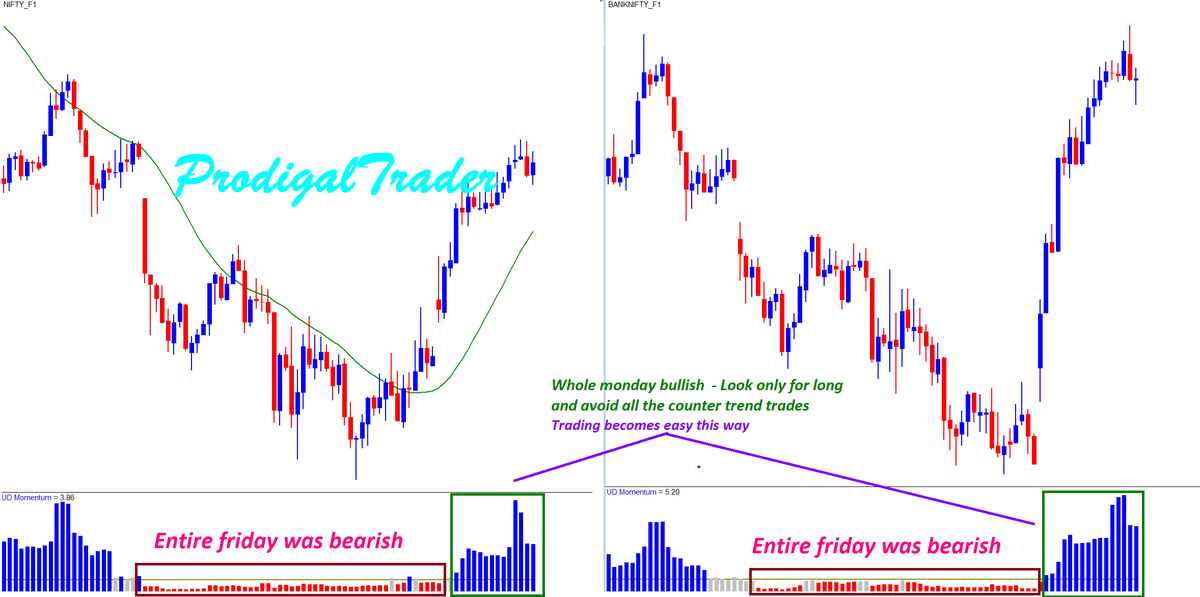
U can guage the strength in the trend once u know how to measure the direction.
This trend strength is infact signals the trend continuity or the potetnial for sustanining the trend.
Thats great assurace to hav https://t.co/HanLvlXkjQ
Before making ur trade entry or even before making a bias of trend as either bullish or bearish, do u use any objective measures to define the trend based on price, volume and momentum?
— Aneesh Philomina Antony (@ProdigalTrader) May 15, 2021
Price will always go back and forth move no matter how strong the trend is.
1/4 pic.twitter.com/qqizh2JO3J