#RSI is a common indicator which most of us use in the stock market.

This learning thread would be on
"๐™๐™จ๐™š๐™จ ๐™ค๐™› ๐™๐™Ž๐™„"

Like๐Ÿ‘ & Retweet๐Ÿ”„ for wider reach and for more such learning thread in the future.

Also, an investment strategy is shared using RSI in the end.

1/16

Setup 1:

RSI- commonly used to show whether price is overbought or oversold.

General rule:
๐‘๐’๐ˆ > ๐Ÿ•๐ŸŽ -- ๐Ž๐ฏ๐ž๐ซ๐›๐จ๐ฎ๐ ๐ก๐ญ
๐‘๐’๐ˆ < ๐Ÿ‘๐ŸŽ -- ๐Ž๐ฏ๐ž๐ซ๐ฌ๐จ๐ฅ๐

One becomes cautious once price becomes overbought and optimistic when price becomes oversold.

2/16
Let's understand this with an example of Laurus Labs:

1. It was in overbought zone and after a few days when a small dip was seen from 693 to 588 (15% downside)

2. It was in oversold zone and after a few days when a small rally was seen from 59 to 107 (82% upside)

3/16
Well, this looks very easy, but it is not.

When a price is in overbought zone and is in momentum, then it can move up without taking a dip and exiting or shorting stock would prove wrong.

When IRCTC was in overbought zone, price went up from 2718 to 6396 (135% rally).

4/16
Similarly, for oversold stock.

When a price is in oversold zone and is crashing, then it can move down without taking an upmove and buying stock would prove wrong.

When DHFL was in oversold zone, price went down from 126 to 11 (91% crash).

5/16
What's the way of trading this then?

If a price is oversold, then wait for the price to turn towards neutral zone and also check on other setup whether support is available or not.
Other setup can be Price Action, Support Lines, Demand Zones, Fibonacci or any indicators.

6/16
If a price is overbought, then wait for the price to turn towards neutral zone and also check on other setup whether resistance is available or not.

Combine multiple setup for high probability trades.

7/16
Setup 2: Divergence

Another popular use of RSI by the traders.

Two types of Divergence:
1. Bullish Divergence
2. Bearish Divergence

Divergence is used by the traders who like to take contra trade (i.e. trade against the actual trend)

8/16
Bullish Divergence:

Condition-
1. Price should form lower lows
2. RSI should form higher lows and in oversold region

Laurus Labs weekly chart- Bullish Divergence.
It went up from 450 to 740 (60% rally)

9/16
Bearish Divergence:

Condition-
1. Price should form higher highs
2. RSI should form lower highs and in overbought region

Neuland Labs weekly chart- Bearish Divergence.
It went up from 2725 to 1500 (45% correction)

10/16
Based on divergence, then can be multiple divergence formed one after the other.

Like two bullish divergence in continuation or two bearish divergence in continuation.
This can be high probable trade setup.

One double bearish divergence is shown in the chart below.

11/16
Final Setup: Using RSI for investment.

Simple setup for long-term investment.

Setup:
1. Select Fundamentally good companies
2. Use monthly time frame
3. Buy if RSI is above 50 on monthly closing basis
4. Sell if RSI goes below 50 on monthly closing basis.

12/16
Let's check charts now.

Asian Paints Monthly Chart.

Condition got satisfied in 2008 when it was trading at 108 and still after 13 years exit condition is not fulfilled in Asian Paints.

CMP is 2982.

Returns of 2660% times in 13 years or 29% CAGR.

Easy right!

13/16
Another example of Deepak Nitrite.

RSI crossed above 50 in 2012 when it was trading at 18.
And RSI crossed below 50 in 2016 and the exit was at 56.

Returns of 210% in four years which means CAGR of 33%.

14/16
Strategy is easy only if one follows all the rule.
Key point is to sit with the patience for the returns.

As quoted by Livermore: "Sit tight when you are Right"

50 is just a random number in investment strategy and one can select their own number for entry and exit.

15/16
I hope everyone got a feel of how RSI can be used.

These are not a universal rules one must follow. One can create their rule or follow someone else rules.

Only important thing is one must follow a fix rule instead of tweaking or changing setup frequently.

16/16

More from Yash Mehta

Over 99% of the option traders lose money in option trading because of not following proper Risk Management and Position Sizing.

In this thread ๐Ÿงต, shared three steps that can help you in Option Trading even with small capital.

A complete course worth โ‚น 50K for free.

1/ Creating a view based on some analysis:

It can be Technical/Chart, Option Chain or some Data analysis.

We have written a thread last week on what all the basic strategies you can use based on your view.

Checkout the thread


Now, after forming a view on a stock or index, don't directly jump to take the position.

Analyze the position first.

Some free tools that you can use are:
- Opstra
- @BeSensibull : Integrated with your Broker

We will talk on how to analyze Nifty Option trades from option selling perspective and what all things to look at.

Same thing you can replicate for Stock or Banknifty Options as well.

2/ Analyzing the position:

Let's say I am having bullish view on Nifty, then I can simply short Put Options and Hedge it as well so that margin requirement will reduce.

Let's assume Nifty is at 17000.

So I am looking to short 17000 PE and Buying 17800 PE.
Option Trading is very difficult to master as there are so many things to understand.

Here is a master thread related that will help a beginner to understand about Options Trading.

A complete course worth Rs 50K for free.

1/ A detailed thread on basics of Option Greeks and how it impacts Options


2/ Basic Option Trading Strategies:

There are many option strategies to trade. But keeping your strategy simple is the key.

In this thread, all the basic option trading strategies are being


3/ What are the things that you should look at before taking any Option


4/ Is Option Selling Possible with Rs 1 Lakh Capital?

Even a beginner can start trading in option selling with capital as low as Rs 1 Lakh.

What are the techniques one can use and how to mitigate the infinite loss risk is shared in this
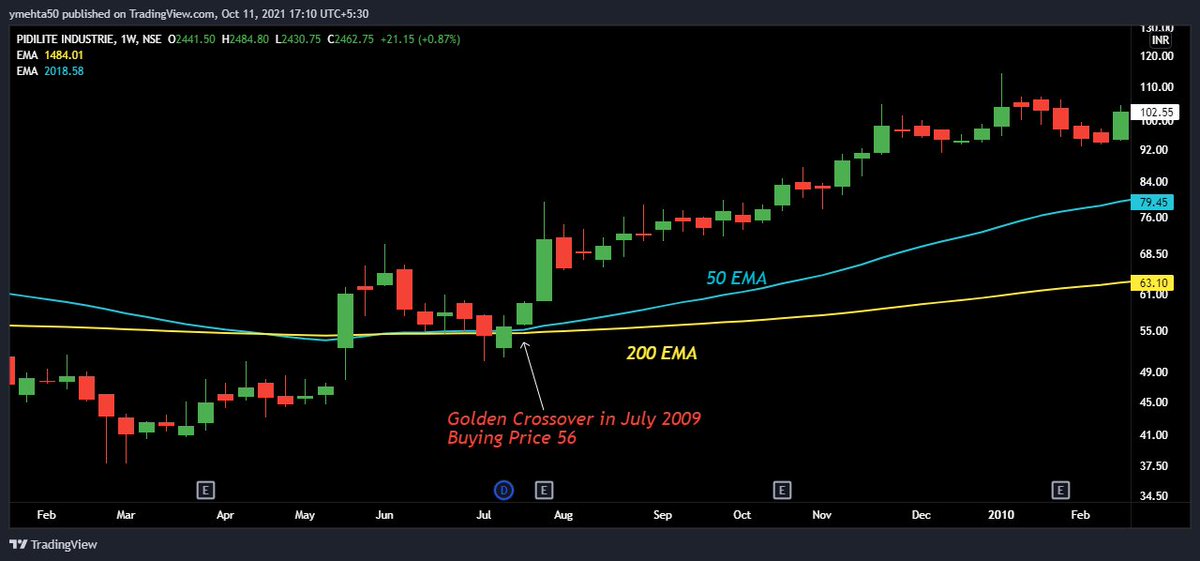
Moving Averages is a common indicator which most of us (novice/professional) use in the stock market for trading and investment.

This learning thread would be on
"๐™๐™จ๐™š๐™จ ๐™ค๐™› ๐™ˆ๐™ค๐™ซ๐™ž๐™ฃ๐™œ ๐˜ผ๐™ซ๐™š๐™ง๐™–๐™œ๐™š"

Like๐Ÿ‘ & Retweet๐Ÿ”„ for wider reach and more such learning thread.

1/10

Basics of the moving average:

It takes average of the price for the duration we want.

So 10 days moving average means an average price of 10 days closing price.

Common types of Moving Average:
Simple, Exponential, Weighted.

Use only one type in your trading setup.

2/10


Different uses:

1โƒฃ Moving Average Crossovers:

Common strategy used by positional traders and investor in finding multibagger or good returns stocks.

Common crossover used is for 50 & 200 Moving Average.

Also, this is called as "๐—š๐—ผ๐—น๐—ฑ๐—ฒ๐—ป ๐—–๐—ฟ๐—ผ๐˜€๐˜€๐—ผ๐˜ƒ๐—ฒ๐—ฟ"

3/10

In this buy signal is initiated when lower MA (50 EMA) crosses above higher MA (200 EMA).
And exit or sell signal is intiated when lower MA (50 EMA) crosses below higher MA (200 EMA).

4/10

Let's see an example:
Pidilite Industries

Buying Price was 56 in 2009 and CMP is 2462 and still there is no selling signal.

44 times Multibagger or 4300% returns.

In lower time frame, it will give more whipsaw and more number of trades.

5/10
In the early stage, most of the traders & investors use indicators in their analysis.

Here is a master thread of how most of the indicators can be used in trading/investing to increase accuracy for free๐Ÿงต:

Also, the last indicator and strategy is my favourite of all in trading.

1/ Moving Average is a very common indicator.

This thread is on what are the different ways of using the moving average


2/ RSI is one of the momentum indicator for traders.

In this thread, I have shared different ways of using RSI. Also, an investing strategy is shared, which can help you to pick stocks that can give you good


3/ CCI is another amazing indicator that is used by momentum traders.

Shared few strategies with CCI which a trader and investor both can


4/ CPR is one of the most popular indicator in the trading community.

This thread covers everything about the CPR indicator and how to use this indicator in

More from Screeners

You May Also Like