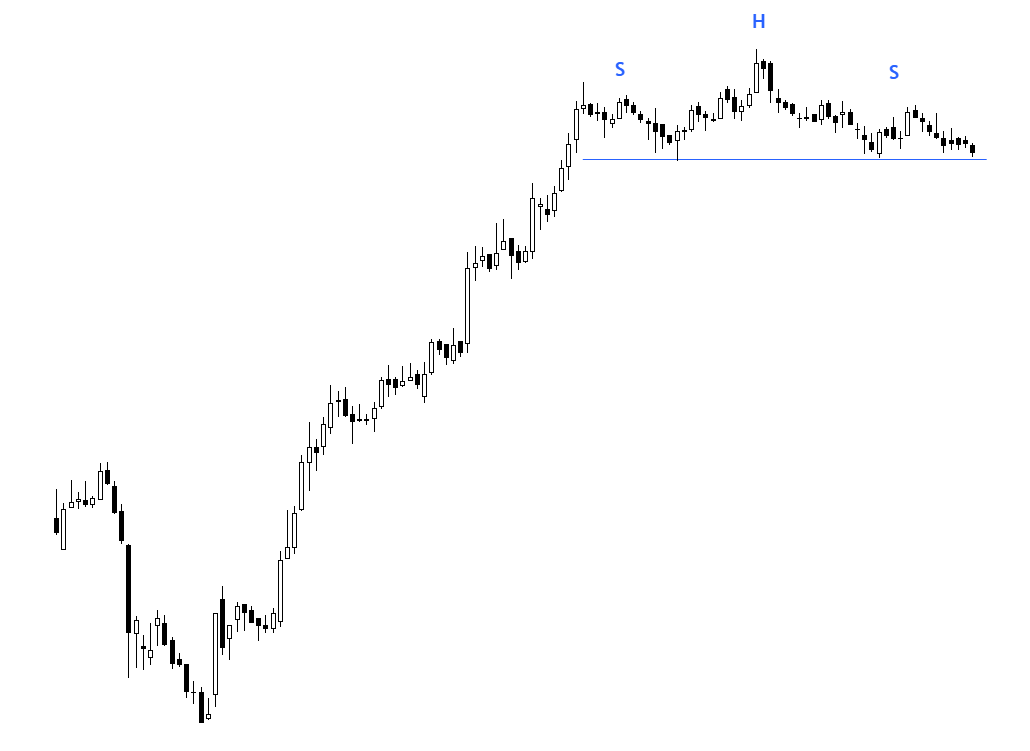
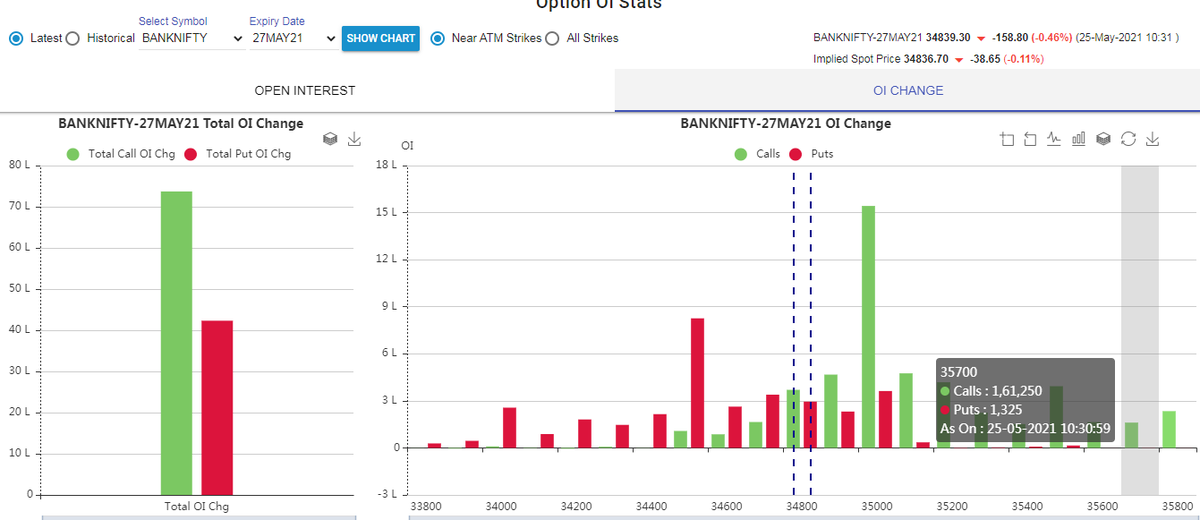
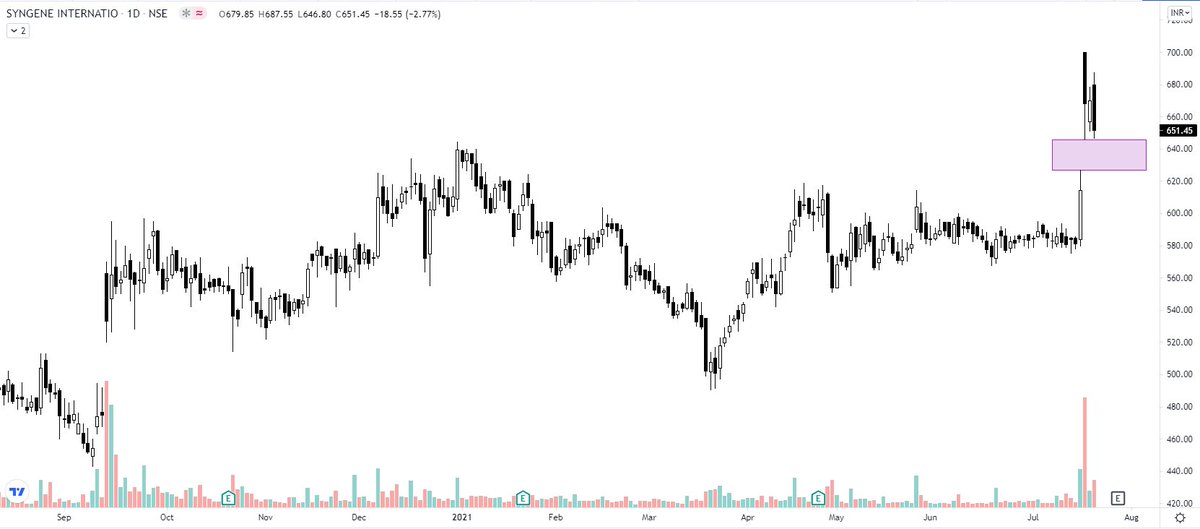
Selling volumes high? NO
Selling candles big? No
Are they doji/spinning tops? Yes
Price in narrow range? Yes
Previous volumes while buying high? Yes, so if someone bought huge, he is still sitting
What's going on? Weak hands booking profits.
IEX - Updated chart https://t.co/GABkSthg5L
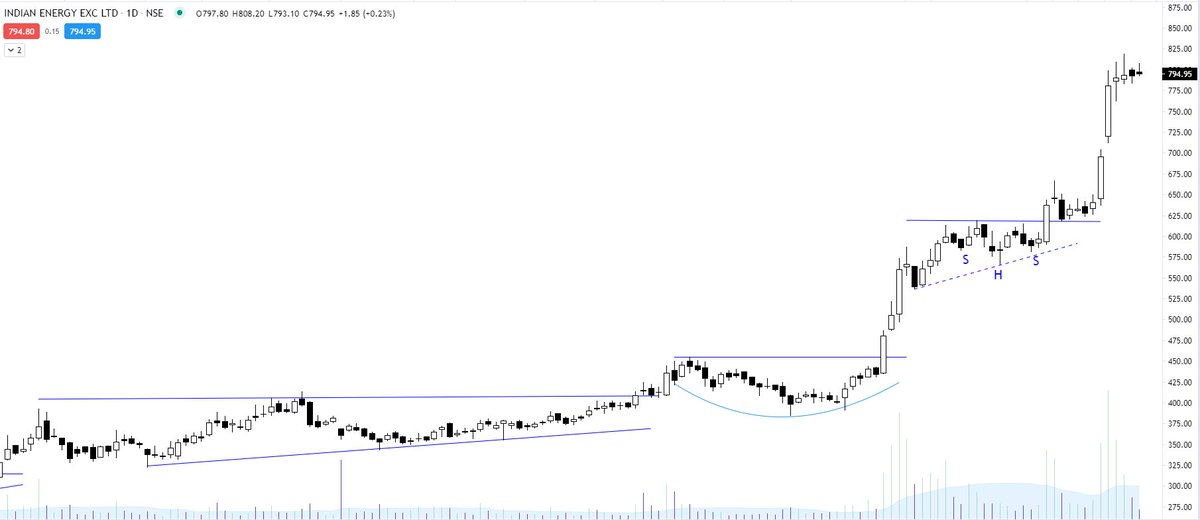
Indian Energy Exchange (IEX) - because you missed the 1st BO maybe at 200/300/400/500 therefore, your brain will keep on saying you - "now it is expensive" but it will keep on going up troubling you more. Perfect trait of a marathon runner. Follow the price with SL. pic.twitter.com/cKH3vnG05l
— The_Chartist \U0001f4c8 (@nison_steve) September 28, 2021
More from The_Chartist 📈

IEX Indian Energy Exchange - ⭕️⭕️
although a must-have portfolio stock. Faced resistance right at the upper channel boundary. Volumes high. Any retracement back to the lower boundary will be an opportunity to accumulate. https://t.co/5uDsUXsbPP
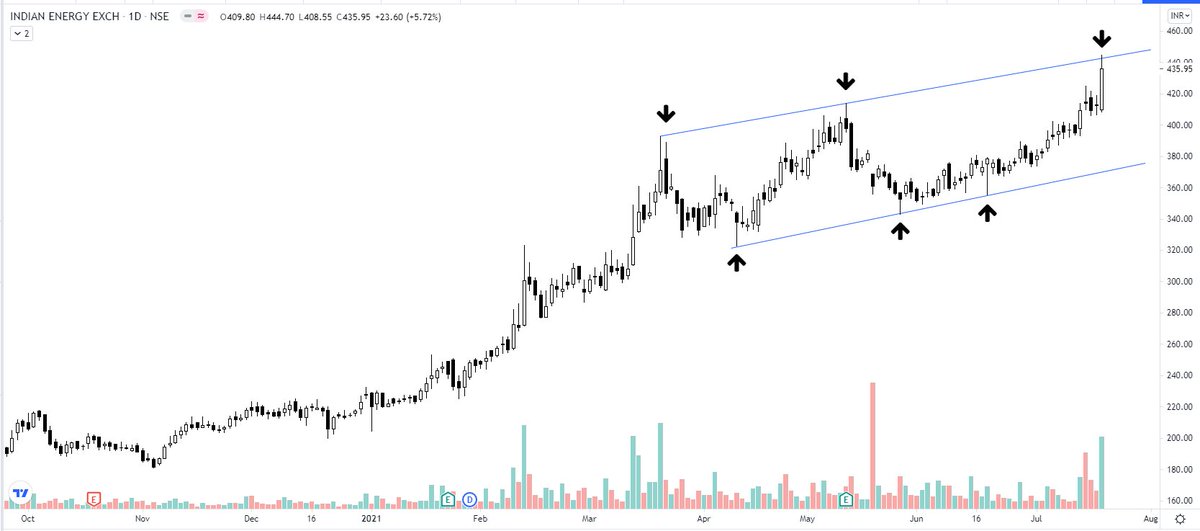
although a must-have portfolio stock. Faced resistance right at the upper channel boundary. Volumes high. Any retracement back to the lower boundary will be an opportunity to accumulate. https://t.co/5uDsUXsbPP
IEX - the resistance turning support. Kindly review, please. @nishkumar1977 @suru27 @rohanshah619 @indian_stockss @sanstocktrader @BissaGauravB @RajarshitaS @PAVLeader @Rishikesh_ADX @VijayThk @Investor_Mohit @TrendTrader85 pic.twitter.com/7CCzmee5If
— Steve Nison (@nison_steve) December 18, 2020