
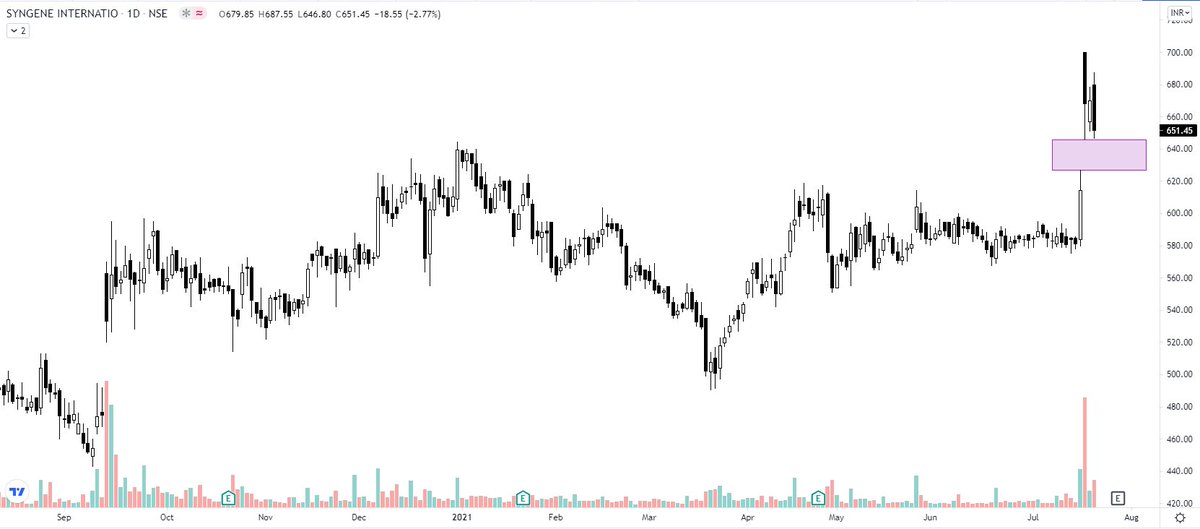
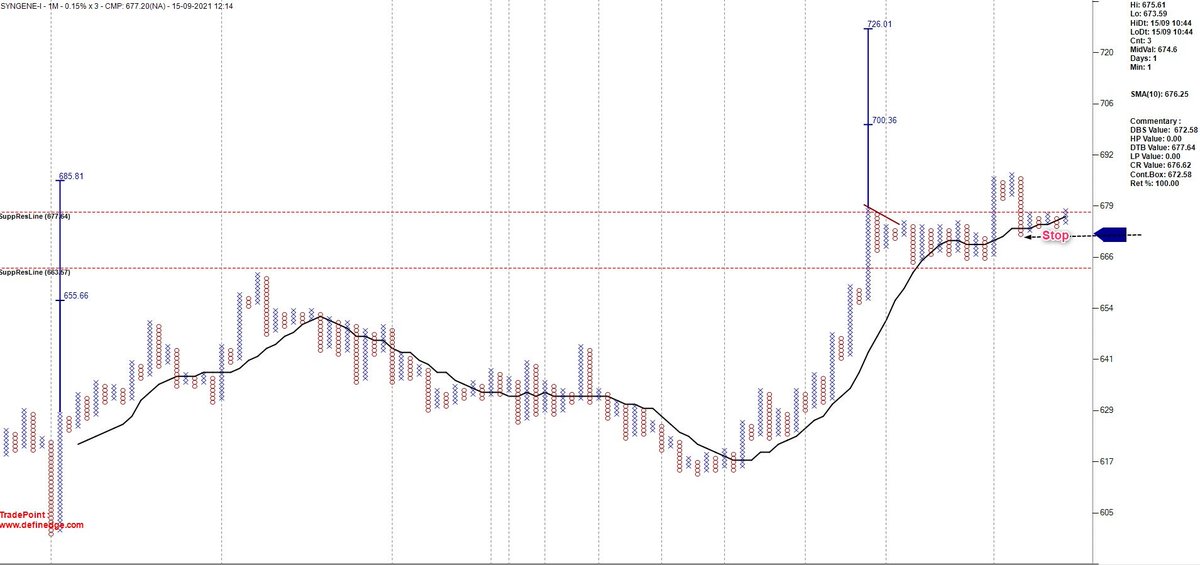
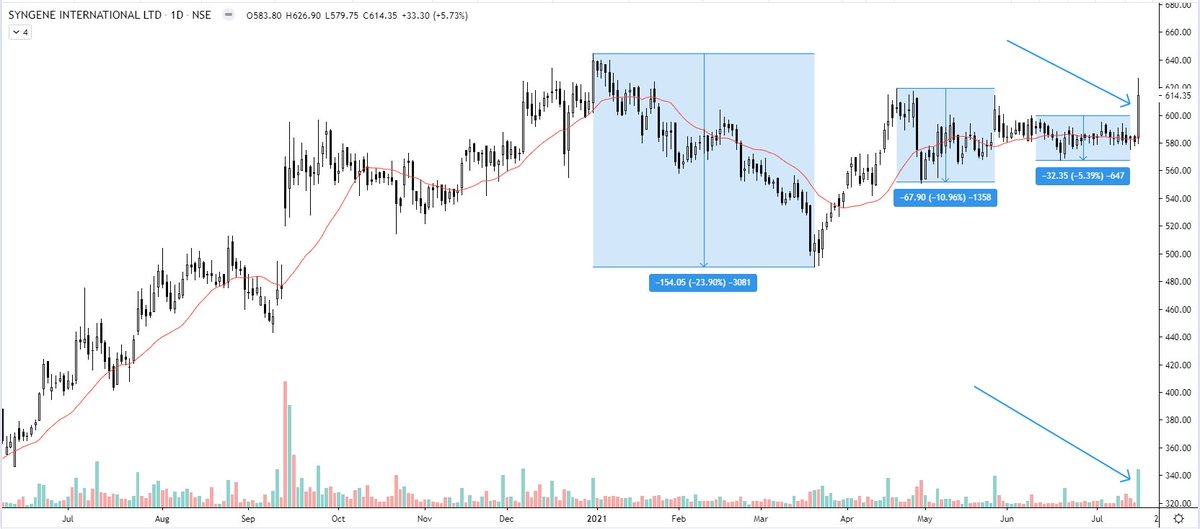
Syngene:
For long term investors - Buy at any dips
PnF Chart (1%*3) Stop loss level - 570 (previous low O's below Anchor column)
Candlesticks Charts - 605 (below gap boundary)
More from Steve Nison
You are seriously missing a lot of information if you are not maintaining a trading journal. It is much better if you also take a snap of the charts you trade for the post-analysis.
This exercise will tell you about your inherent strengths & weaknesses. 👇👇
This exercise will tell you about your inherent strengths & weaknesses. 👇👇
How to record a trading journal (TJ) & what to analyze?
— The_Chartist \U0001f4c8 (@charts_zone) December 14, 2021
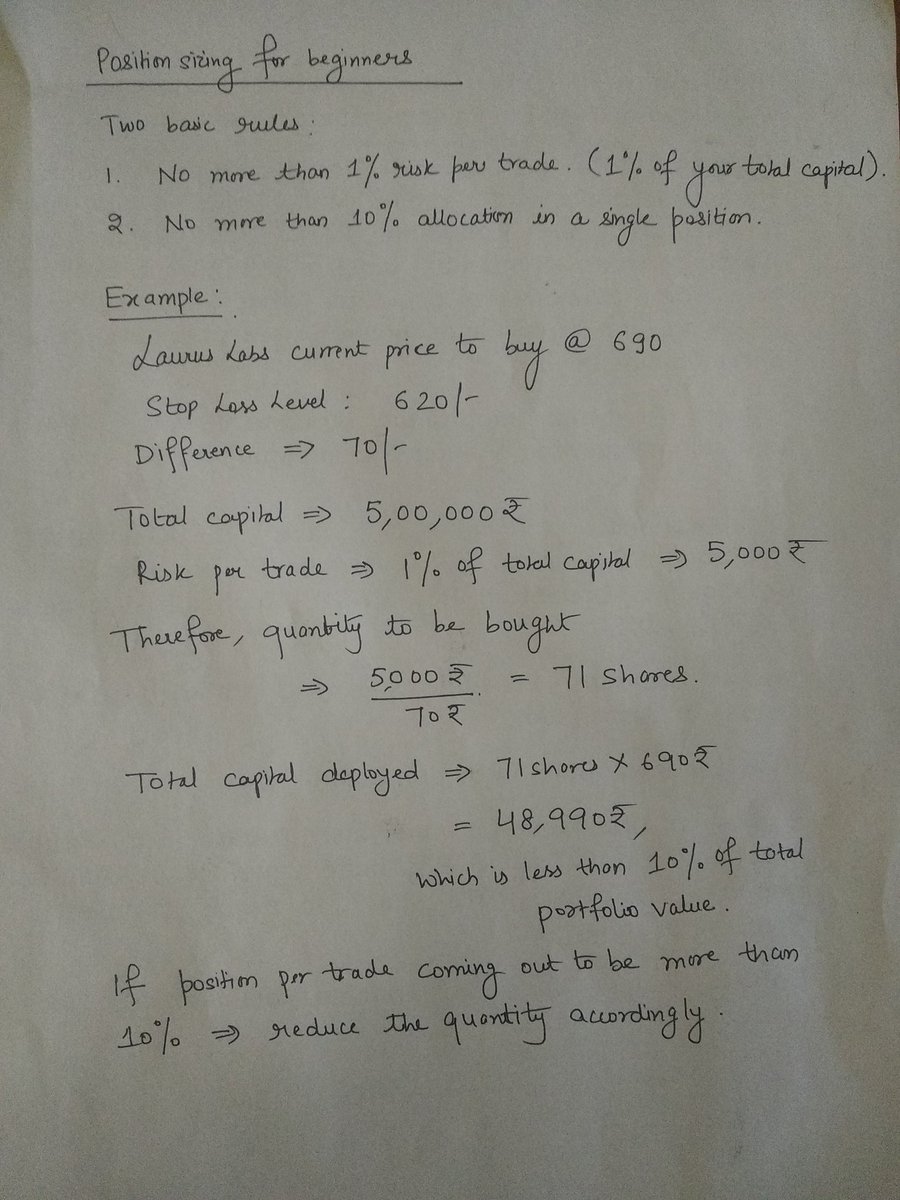
What is in a TJ?
Buy Date
Stock Name
The time frame you analyzed (D/W/M)
Long/Short?
Buy Price
SL
Sell Price
Risk took (% of capital)
Sell date
No. of days held
P/L
P/L as % of capital
Buy Reason?
Invested capital/trade pic.twitter.com/WnrvmYuOV0
More from Syngene


Syngene - Same concept. Price contraction. Shift from weak to strong hands through repeated volatility contractions. I can well write one whole page explanation on it. Look at the volume pump today. A big hand will never let you ride with him. Make sure you are there at the party https://t.co/RN8sQYzdBg
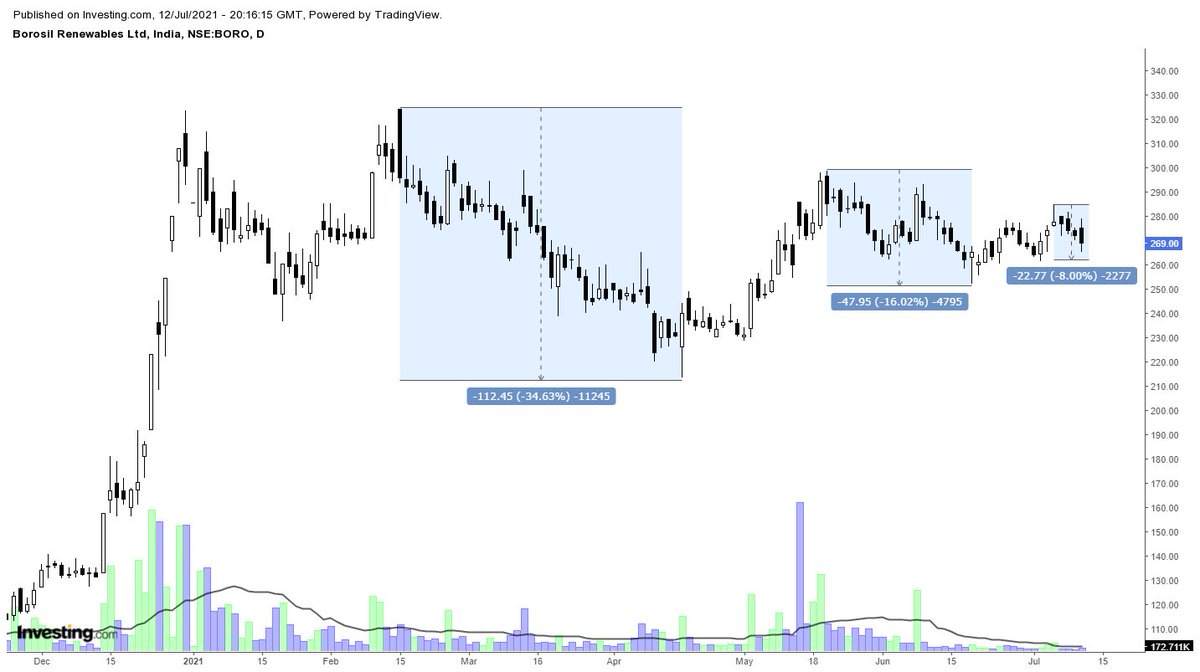
Borosil Renewables - Patterns like these must be looked at carefully and must be kept on the radar. Herein price is contracting which generally signifies shifting of hands (from weak to strong). If you go wrong, the risk is limited in these. pic.twitter.com/iqyoeslZjy
— Steve Nison (@nison_steve) July 12, 2021


#SYNGENE-648
Showing strength..towards 3.618%(778)
#Probability
Showing strength..towards 3.618%(778)
#Probability
#SYNGENE -618
— MaRkET WaVES (DINESH PATEL ) Stock Market FARMER (@idineshptl) August 26, 2021
Sustain rise above 622.15 (2.618%)
Near term objective is to move higher towards 3.618%(778) & 4.618%(935)
Long term perspective base Case 212.#Probability pic.twitter.com/L5z4qUDP73


