
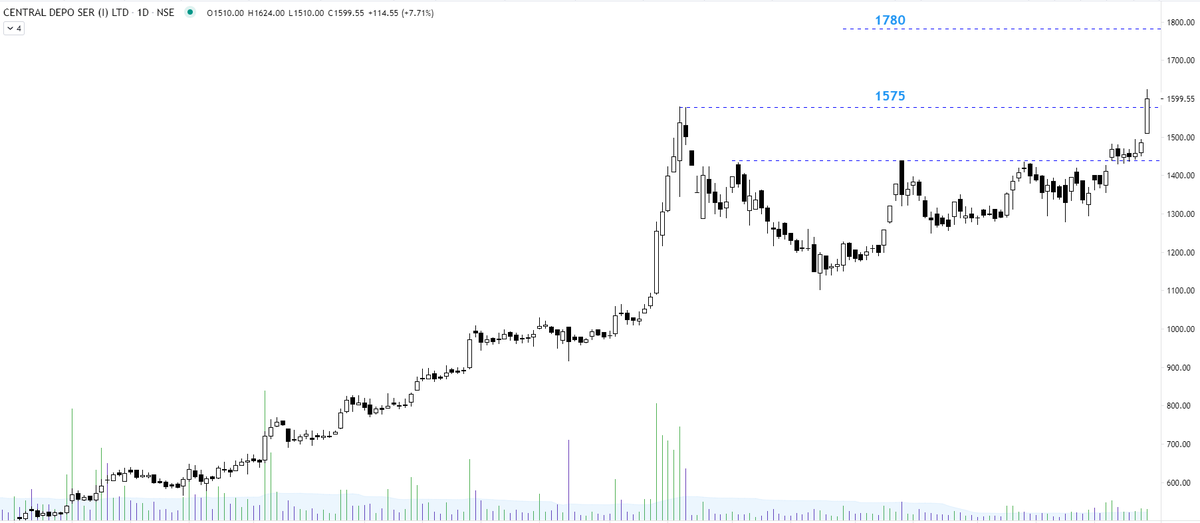
Moving Averages I use:
200 MA - for uptrend/downtrend classification
> 50 MA - strong uptrend and never going down below it
> 20 MA - and bouncing back from it - Super-strong counter
More from The_Chartist 📈

These high-volume selloff candles right before any -ve news always intrigue me. the same thing happened with Infosys before the whistleblower complaint was out & the stock gapped down. TV 18 & VTL were other examples.
Fresh case - RUPA https://t.co/nqq5nI1wLU
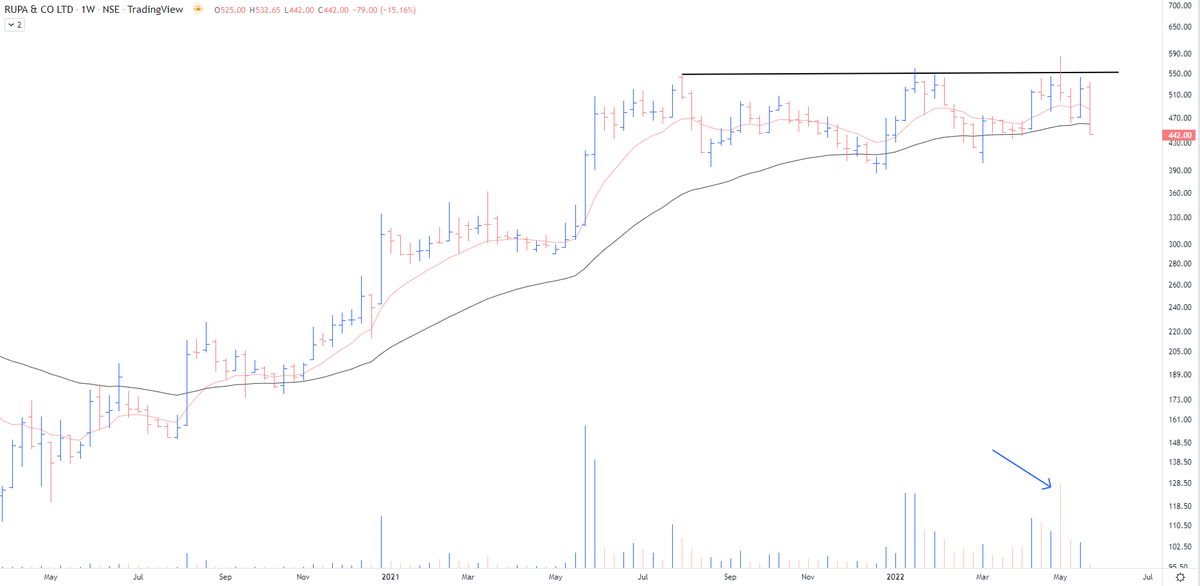
Fresh case - RUPA https://t.co/nqq5nI1wLU
Respect your stop losses in the stocks that have gone down today with heavy volumes even on a strong day.
— The_Chartist \U0001f4c8 (@charts_zone) March 17, 2022
VTL pic.twitter.com/3pJ9XngCDL
More from Screeners


You May Also Like

So friends here is the thread on the recommended pathway for new entrants in the stock market.
Here I will share what I believe are essentials for anybody who is interested in stock markets and the resources to learn them, its from my experience and by no means exhaustive..
First the very basic : The Dow theory, Everybody must have basic understanding of it and must learn to observe High Highs, Higher Lows, Lower Highs and Lowers lows on charts and their
Even those who are more inclined towards fundamental side can also benefit from Dow theory, as it can hint start & end of Bull/Bear runs thereby indication entry and exits.

Next basic is Wyckoff's Theory. It tells how accumulation and distribution happens with regularity and how the market actually
Dow theory is old but
Here I will share what I believe are essentials for anybody who is interested in stock markets and the resources to learn them, its from my experience and by no means exhaustive..
First the very basic : The Dow theory, Everybody must have basic understanding of it and must learn to observe High Highs, Higher Lows, Lower Highs and Lowers lows on charts and their
Even those who are more inclined towards fundamental side can also benefit from Dow theory, as it can hint start & end of Bull/Bear runs thereby indication entry and exits.
Next basic is Wyckoff's Theory. It tells how accumulation and distribution happens with regularity and how the market actually
Dow theory is old but
Old is Gold....
— Professor (@DillikiBiili) January 23, 2020
this Bharti Airtel chart is a true copy of the Wyckoff Pattern propounded in 1931....... pic.twitter.com/tQ1PNebq7d


