Hello Friends 🤗
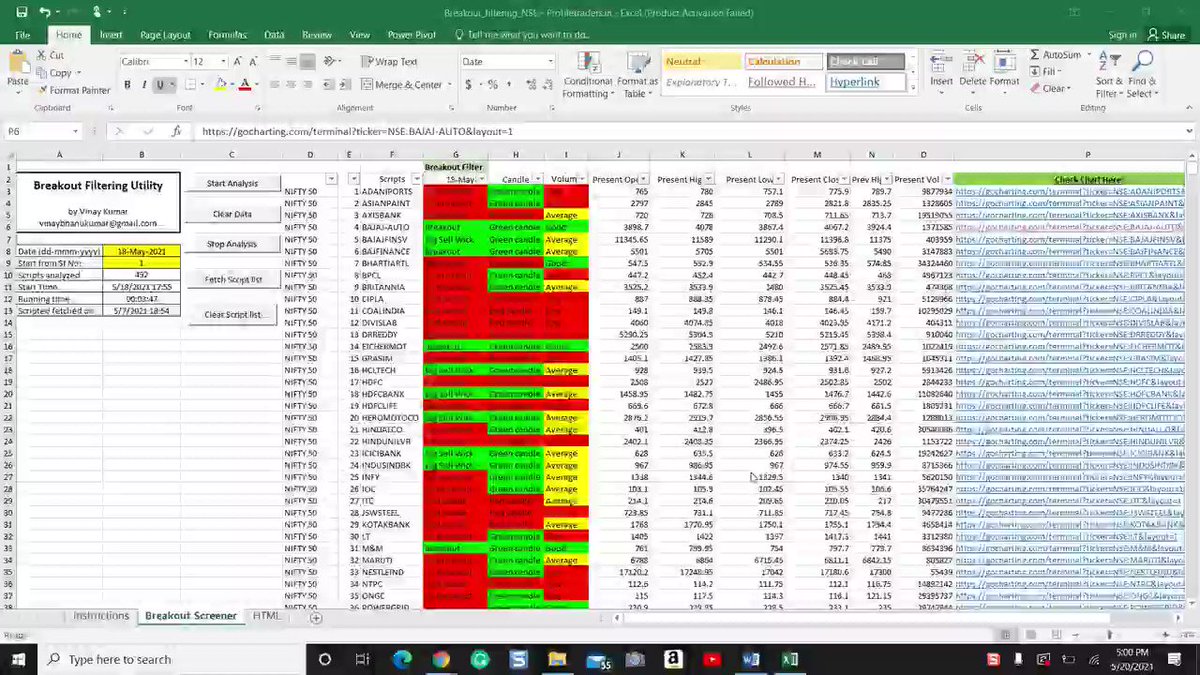
Here is my filter to identify short term breakout in #stocks
Save it & Make a part of your trading tool
More from Stock Market Scientist™
Here are the links of some important threads of bearish reversal candlestick patterns for new TA learners📒
1️⃣Bearish Engulfing
https://t.co/OKlGOb8zts
2️⃣Evening Star
https://t.co/ZR13zhZUt8
3️⃣3 Black Crows
https://t.co/NQunzmm31E
Happy Learning..!😇
Bearish Engulfing Simplified\U0001f4d2
— Stock Market Scientist\u2122 (@MarketScientist) June 6, 2020
\U0001f535It consists of a small \xa0(green)candle\xa0followed by a large down (red)candle that engulf the smaller candle
\U0001f535It generally appears near the end of an uptrend or in the pullbacks of a larger downtrend
\U0001f535It is one of the reliable reversal pattern pic.twitter.com/9EQqdcvsSa
Here are the links of some important threads of TA 📊 for new learners to study 😇😇
1️⃣Moving Avg
https://t.co/xbORdUm2MH
2️⃣Fibonacci
https://t.co/QS2FveTuF7
3️⃣Ichimoku
https://t.co/pITLA6IL9m
4️⃣Darvas Box Theory
https://t.co/PJ70uverV4
Happy Learning😇
Moving Averages Simplified\U0001f4d2
— Stock Market Scientist\u2122 (@MarketScientist) April 30, 2020
\U0001f535Its a technical indicator used by traders to identify trading opportunities
\U0001f535Its a Lagging indicator
\U0001f5352 MAs which traders use more often are..
SMA(Simple moving average) & EMA(Exponential moving average)
1/n#StockMarket #Technicals pic.twitter.com/ClDPEgVWZP

Here are the links of some important threads of TA 📊 to go through on holiday.
1️⃣Moving Avg
https://t.co/xbORdUm2MH
2️⃣Fibonacci
https://t.co/QS2FveTuF7
3️⃣Ichimoku
https://t.co/pITLA6IL9m
4️⃣Darvas Box Theory
https://t.co/PJ70uverV4
Happy Learning😇
Moving Averages Simplified\U0001f4d2
— Stock Market Scientist\u2122 (@MarketScientist) April 30, 2020
\U0001f535Its a technical indicator used by traders to identify trading opportunities
\U0001f535Its a Lagging indicator
\U0001f5352 MAs which traders use more often are..
SMA(Simple moving average) & EMA(Exponential moving average)
1/n#StockMarket #Technicals pic.twitter.com/ClDPEgVWZP
Here are the links to access all the threads of Price Patterns📈
1️⃣H&S Pattern
https://t.co/fmWhajgRFk
2️⃣C&H Pattern
https://t.co/6ZW977dCbr
3️⃣Flag Patterns
https://t.co/YUVRiLrVgI
4️⃣Wedge Patterns
https://t.co/6Lhka9dgyw
Happy Learning..!! 😇
H & S Pattern Simplified\U0001f4d2
— Stock Market Scientist\u2122 (@MarketScientist) May 25, 2020
Head & Shoulder Pattern\U0001f4ca
\U0001f535It is\xa0formed by a peak (shoulder), followed by a higher peak (head), & then another lower peak (shoulder)
\U0001f535A line called neckline\xa0is\xa0drawn by connecting the lowest points of the two troughs
1/n#StockMarket #Technicals pic.twitter.com/ElCKkli5h3