RSI is almost perfect indicator.
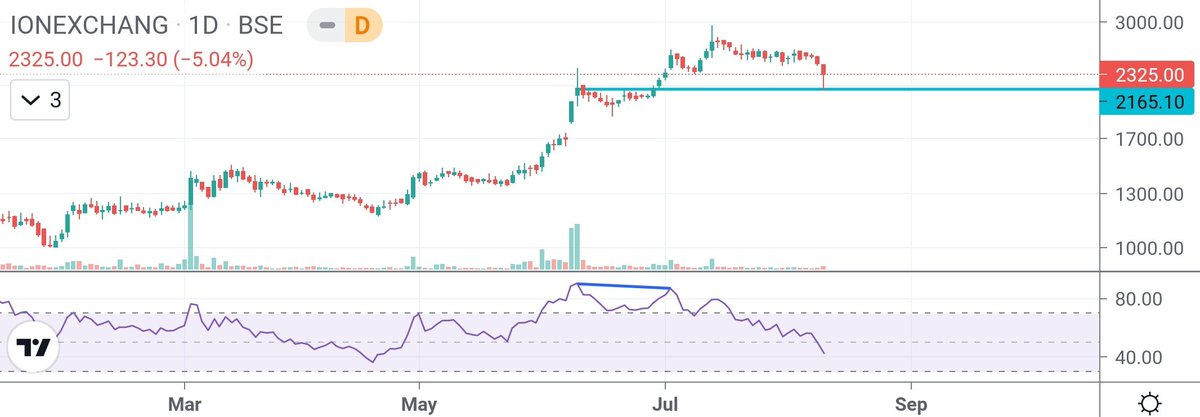
Ion Ex: RSI made top on 10 June and stock closed at 2178.9.There was a divergence on the chart as RSI kept making LH but price kept up.But in yesterday's correction, price exactly visited the closing price of RSI top and cleared the divergence.
More from Mayank Narula
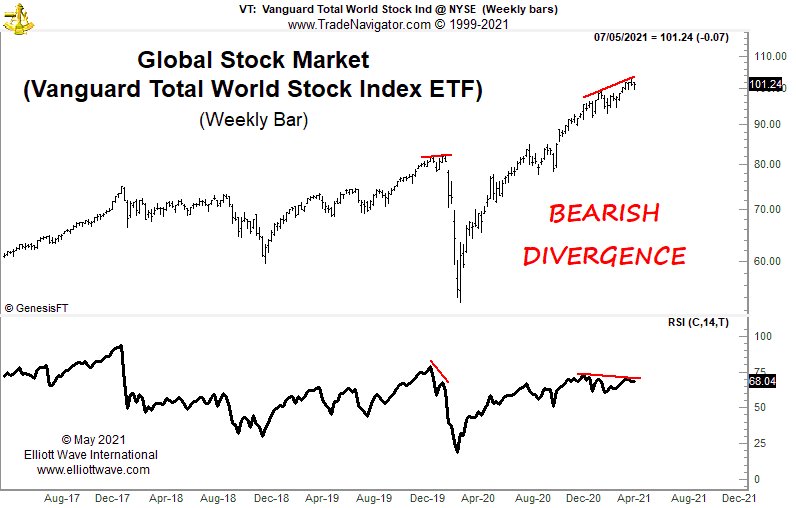
Monthly divergence may come into play.
I said best case scenario is market dump over next few months, and it's happening now.
I won't be surprised if it takes off to new all time high after flushing out new entrants.
#BITCOIN
— Mayank Narula (@Mayank_Narula1) March 5, 2022
Pending RSI divergence on monthly chart which requires a dip under 13805 to get resolved.
But monthly RSI divergences can go on for years before the resolution.
Best case scenario will be panic dump over next few months. pic.twitter.com/hi67hMg9sZ
More from Rsi


Have put it in pictorial form.
Read the whole thread to understand better.
Retweet to help everyone understand better. https://t.co/vPYoGgQEqm

A Tattoo has been posting selective screenshots of my Tweets to this followers to showcase how I do not know how to use RSI.
— Nishant Kumar (@nishkumar1977) November 29, 2020
While he runs his shop showing other people down, here are the basics for the wise:
1) RSI above 70 gets into overbought zone but it's the crossover from

Thought provoking, cant learn this sort of applications so quickly from books.
Learnt new ways of looking at RSI 👍
RSI is one of the most versatile indicators in the stock market.
— elearnmarkets (@elearnmarkets) July 3, 2021
View Webinar: https://t.co/Mlov60NPY2
Join @jhunjhunwala_b and learn how to pick multibagger stocks based on some RSI range rules
Use Code WEB20 for 20% OFF.#rsi #stockmarketindia #stocks #profits pic.twitter.com/eVu3SlsxaJ
You May Also Like


A thread 👇
https://t.co/xj4js6shhy
Entrepreneur\u2019s mind.
— James Clear (@JamesClear) August 22, 2020
Athlete\u2019s body.
Artist\u2019s soul.
https://t.co/b81zoW6u1d
When you choose who to follow on Twitter, you are choosing your future thoughts.
— James Clear (@JamesClear) October 3, 2020
https://t.co/1147it02zs
Working on a problem reduces the fear of it.
— James Clear (@JamesClear) August 30, 2020
It\u2019s hard to fear a problem when you are making progress on it\u2014even if progress is imperfect and slow.
Action relieves anxiety.
https://t.co/A7XCU5fC2m
We often avoid taking action because we think "I need to learn more," but the best way to learn is often by taking action.
— James Clear (@JamesClear) September 23, 2020