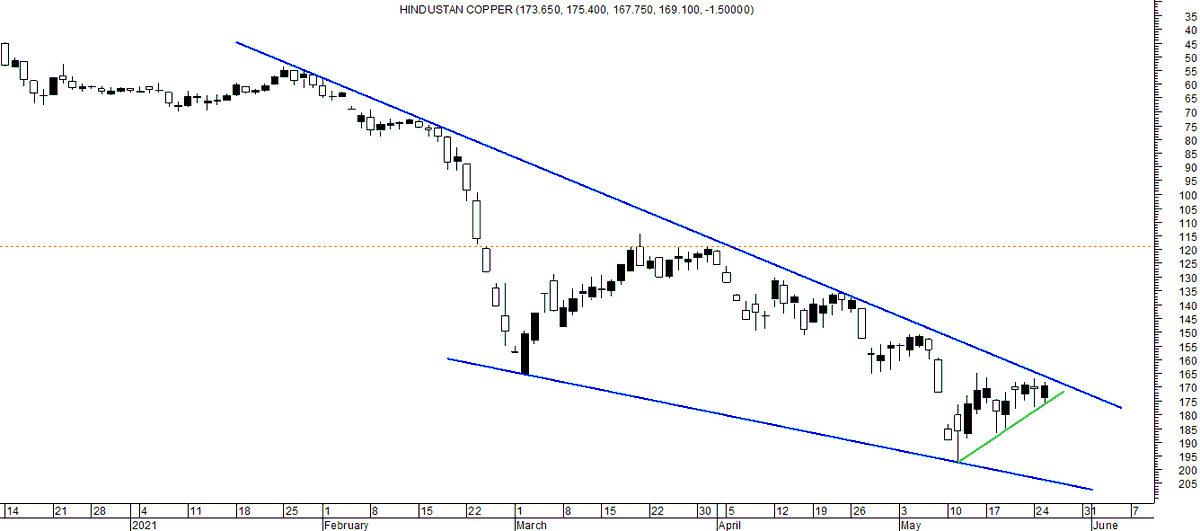
Hindcopper target 101.
Take a look 👇👇👇
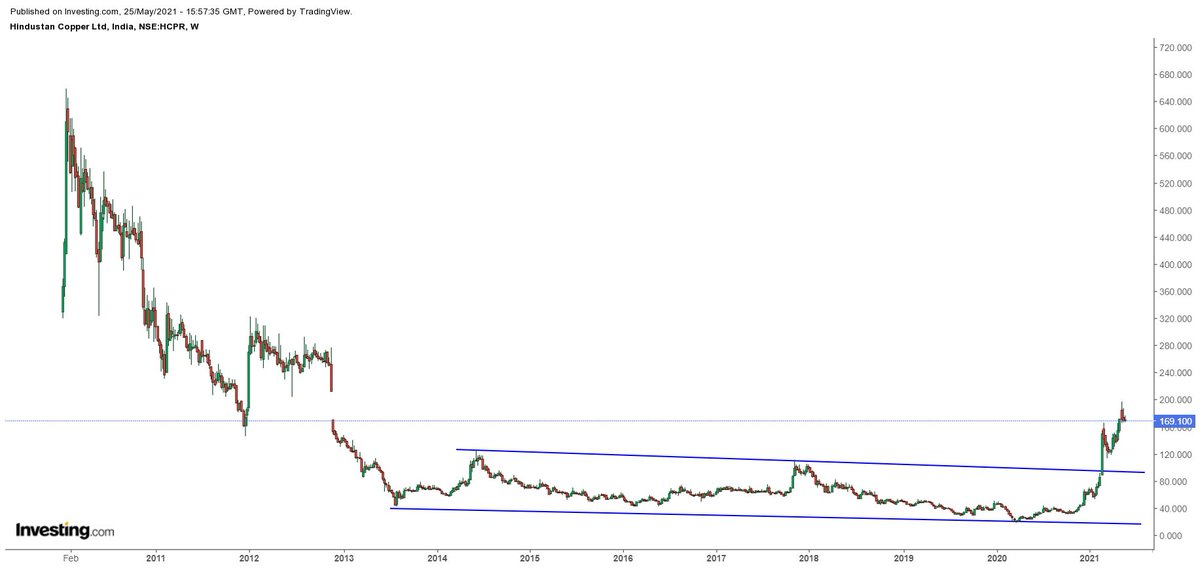
Hindustan Copper Monthly Chart CMP 144.15
— Nimblr (@Deishma) June 19, 2021
.
Fall till
115
105
101
without which down trend will not get support. pic.twitter.com/JiNliVWkJ4
More from Shivaji Vitthalrao🇮🇳
Today I see a very strong signal of this happening in 3-4 years. Trail sl as pernur risk.
#Indiacem
India Cement Could not cross 226 in the last attempt to trigger multi year breakout.
— Shivaji Vitthalrao\U0001f1ee\U0001f1f3 (@shivaji_1983) September 2, 2021
Stock in this leg crossing 212 can trigger this 14 years breakout. CMP 180 taking a SL 150
Revised Target 4 digits by 2024-2025. I am not kidding \U0001f600#Indiacement https://t.co/xhWjqrJm4j pic.twitter.com/42Q8qO7tO7
105 is key, Bulls might defend for the time being. Once they fail during any downtrend Boy Bulls will be in serious trouble.
First targets 90-95 and worst case 65-70 (This i wil review later) https://t.co/RYaMwRQb7e
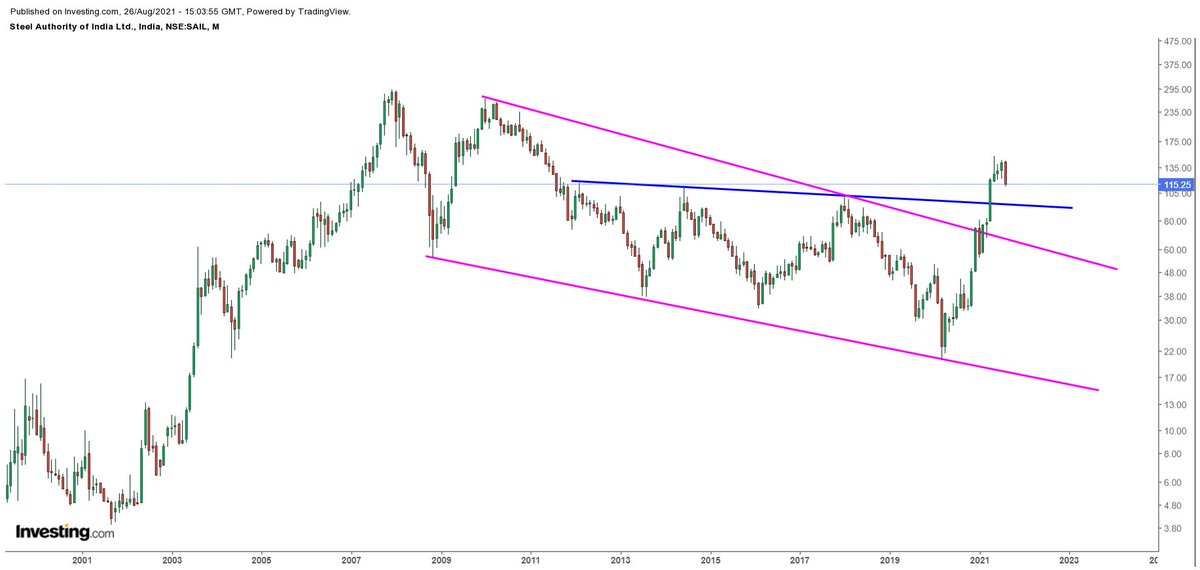
Angle 2 -- On Log scale its end of this upmove from March 2020.
— Shivaji Vitthalrao\U0001f1ee\U0001f1f3 (@shivaji_1983) August 24, 2021
No major support until 90-92.
Conclusion - any rise to 123-128 is a sell opportunity
Bullish only above 145. Personally not bulish.
Potential taregts on downside are 105-90#SAIL pic.twitter.com/yZv2WXwIMU
Longs Alert take care. Stock looks weak to me below 135.
#hindcopper https://t.co/hnXBWmcPEX
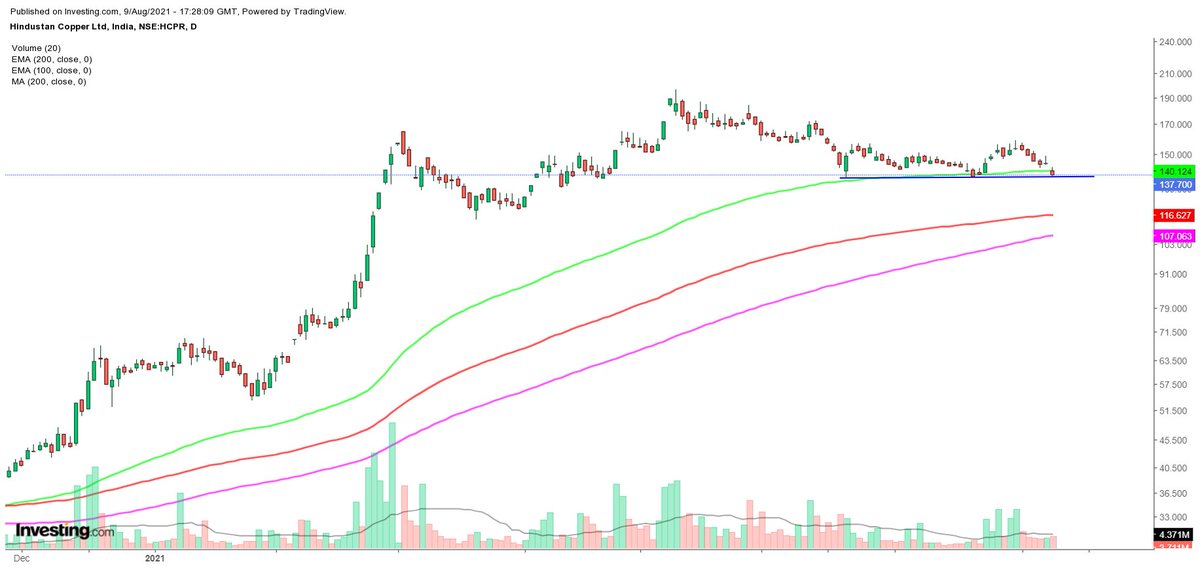
Hindcopper unable to cross 158 and required bullish momentum missing.
— Shivaji Vitthalrao\U0001f1ee\U0001f1f3 (@shivaji_1983) August 9, 2021
Closing below 135 is weak signal.
Would like to wait n watch before commenting further on this stock.
Dosc: Holding "NO Longs" in this stock. https://t.co/qGAnigXBB7
More from Nishhindcopper


You May Also Like


He has been wrong (or lying) so often that it will be nearly impossible for me to track every grift, lie, deceit, manipulation he has pulled. I will use...

... other sources who have been trying to shine on light on this grifter (as I have tried to do, time and again:
Ivor Cummins BE (Chem) is a former R&D Manager at HP (sourcre: https://t.co/Wbf5scf7gn), turned Content Creator/Podcast Host/YouTube personality. (Call it what you will.)
— Steve (@braidedmanga) November 17, 2020
Example #1: "Still not seeing Sweden signal versus Denmark really"... There it was (Images attached).
19 to 80 is an over 300% difference.
Tweet: https://t.co/36FnYnsRT9

Example #2 - "Yes, I'm comparing the Noridcs / No, you cannot compare the Nordics."
I wonder why...
Tweets: https://t.co/XLfoX4rpck / https://t.co/vjE1ctLU5x

Example #3 - "I'm only looking at what makes the data fit in my favour" a.k.a moving the goalposts.
Tweets: https://t.co/vcDpTu3qyj / https://t.co/CA3N6hC2Lq