
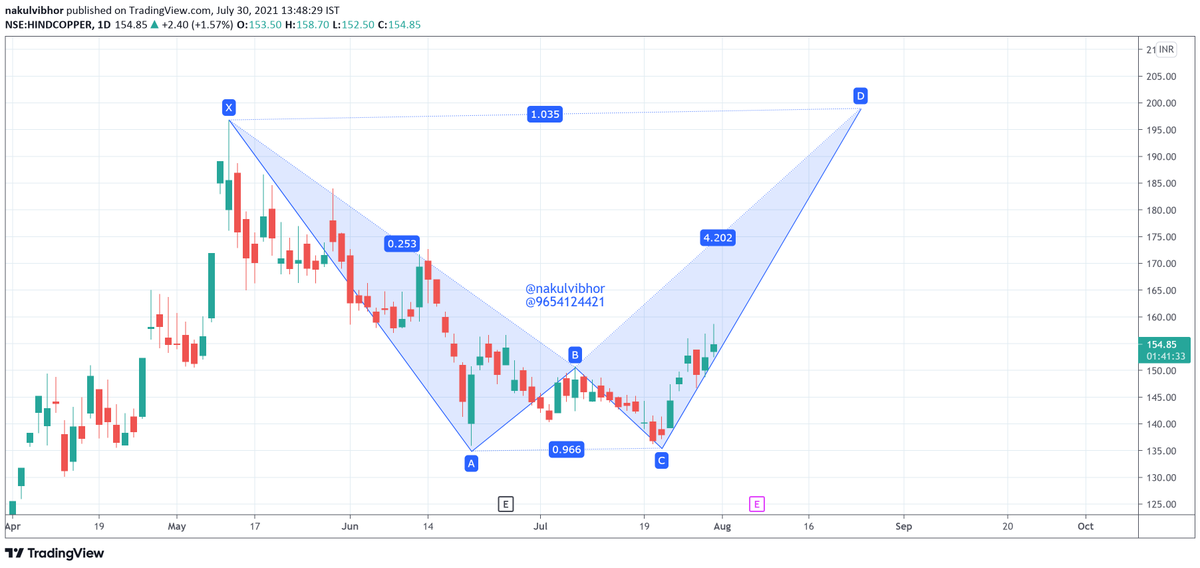
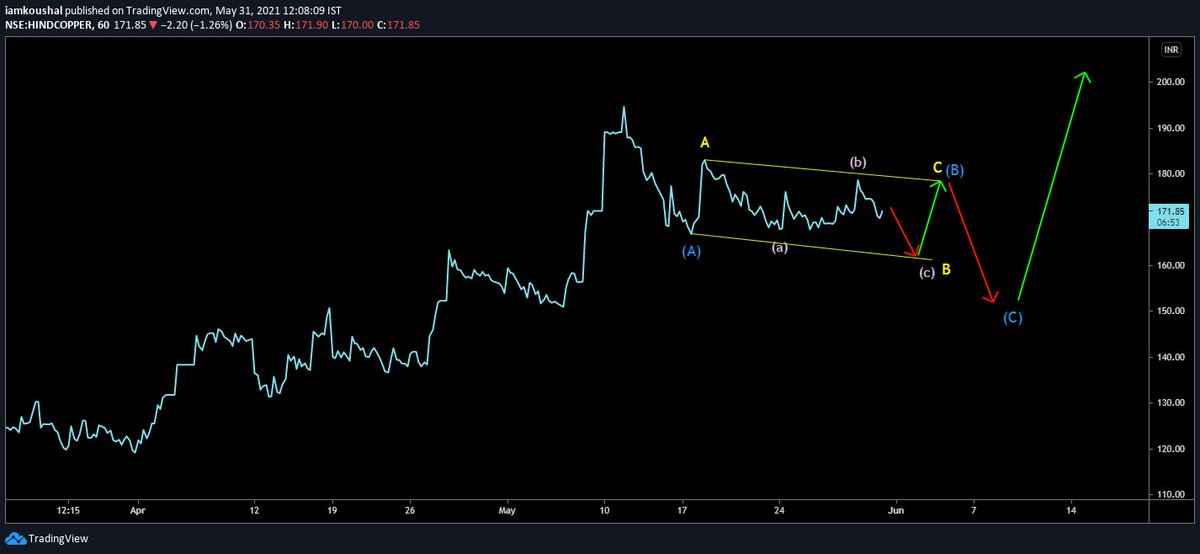
hind copper
trying to form leg D
seems like had created a small base at 135 levels
can give a good run up
one can add here at 154 for 183 - 192
keeping sl 133 clbs
More from Vibhor Varshney
Infoedge started to move
70 points up
Keep trailing SL
Those who missed yesterday
Can add now as well
👍🏻
70 points up
Keep trailing SL
Those who missed yesterday
Can add now as well
👍🏻
Positional call
— Vibhor Varshney (@nakulvibhor) June 15, 2021
Holding period 1 month
Buy naukri / infoedge
Both are same stock
Cash or future as per risk capacity
Cmp 4900
Sl 4187
Target 5879 - 6277 - 6788
Good fundamental stock
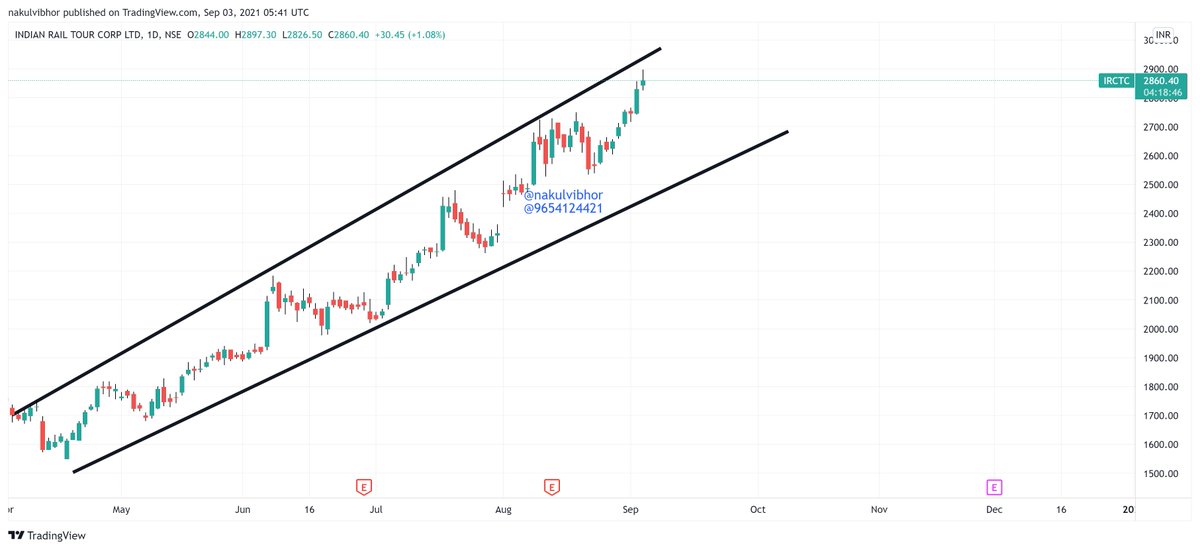
irctc
approching upper trendine , might took a small pause or need to break resistance with good volumes
target was 2900 , made high 2897 , with just 3 points short.
booking some positions as reached near resistance , will add near supportive trendline,
holding rest for 3600 https://t.co/2H0myGPgu5
approching upper trendine , might took a small pause or need to break resistance with good volumes
target was 2900 , made high 2897 , with just 3 points short.
booking some positions as reached near resistance , will add near supportive trendline,
holding rest for 3600 https://t.co/2H0myGPgu5
Itctc
— Vibhor Varshney (@nakulvibhor) September 2, 2021
Entered 2800 \u2705
Heading towards 2900 target
Then 3600
Holding personally in folio \U0001f44d https://t.co/jd2OOQTSLs
More from Nishhindcopper


You May Also Like


Keep dwelling on this:
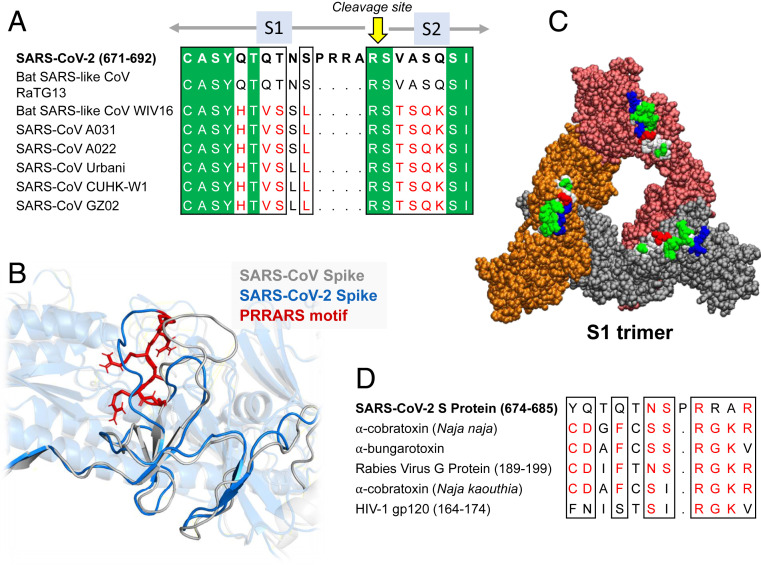
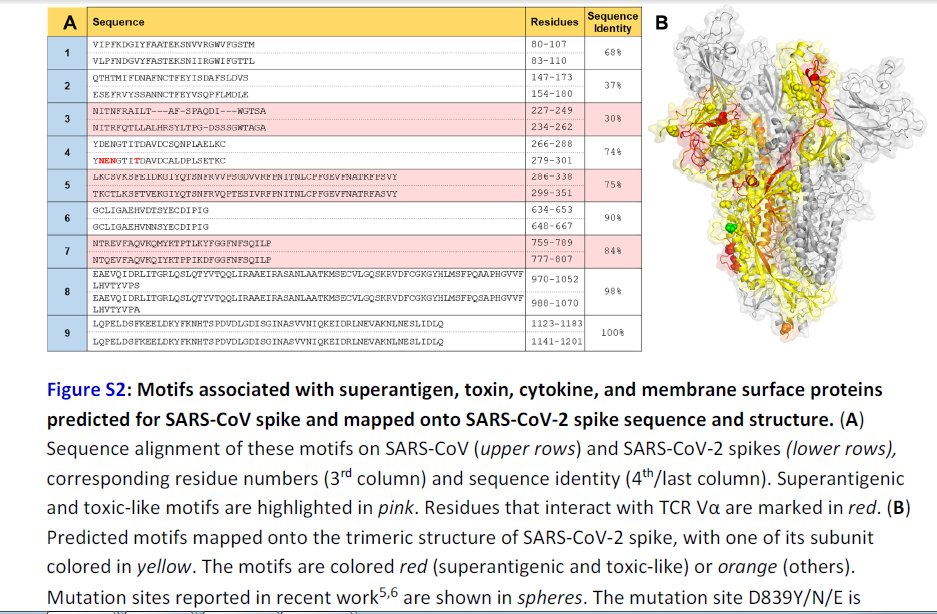
Further Examination of the Motif near PRRA Reveals Close Structural Similarity to the SEB Superantigen as well as Sequence Similarities to Neurotoxins and a Viral SAg.
The insertion PRRA together with 7 sequentially preceding residues & succeeding R685 (conserved in β-CoVs) form a motif, Y674QTQTNSPRRAR685, homologous to those of neurotoxins from Ophiophagus (cobra) and Bungarus genera, as well as neurotoxin-like regions from three RABV strains
(20) (Fig. 2D). We further noticed that the same segment bears close similarity to the HIV-1 glycoprotein gp120 SAg motif F164 to V174.
https://t.co/EwwJOSa8RK
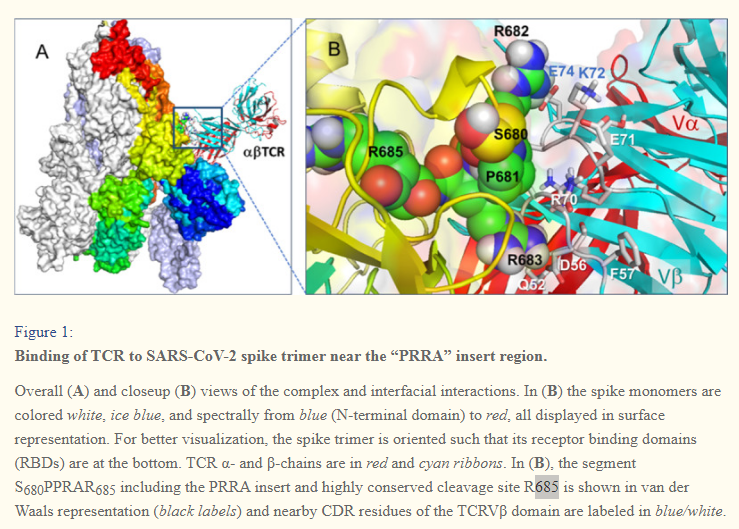
In (B), the segment S680PPRAR685 including the PRRA insert and highly conserved cleavage site *R685* is shown in van der Waals representation (black labels) and nearby CDR residues of the TCRVβ domain are labeled in blue/white
https://t.co/BsY8BAIzDa
Sequence Identity %
https://t.co/BsY8BAIzDa
Y674 - QTQTNSPRRA - R685
Similar to neurotoxins from Ophiophagus (cobra) & Bungarus genera & neurotoxin-like regions from three RABV strains
T678 - NSPRRA- R685
Superantigenic core, consistently aligned against bacterial or viral SAgs
Further Examination of the Motif near PRRA Reveals Close Structural Similarity to the SEB Superantigen as well as Sequence Similarities to Neurotoxins and a Viral SAg.
The insertion PRRA together with 7 sequentially preceding residues & succeeding R685 (conserved in β-CoVs) form a motif, Y674QTQTNSPRRAR685, homologous to those of neurotoxins from Ophiophagus (cobra) and Bungarus genera, as well as neurotoxin-like regions from three RABV strains
(20) (Fig. 2D). We further noticed that the same segment bears close similarity to the HIV-1 glycoprotein gp120 SAg motif F164 to V174.
https://t.co/EwwJOSa8RK
In (B), the segment S680PPRAR685 including the PRRA insert and highly conserved cleavage site *R685* is shown in van der Waals representation (black labels) and nearby CDR residues of the TCRVβ domain are labeled in blue/white
https://t.co/BsY8BAIzDa
Sequence Identity %
https://t.co/BsY8BAIzDa
Y674 - QTQTNSPRRA - R685
Similar to neurotoxins from Ophiophagus (cobra) & Bungarus genera & neurotoxin-like regions from three RABV strains
T678 - NSPRRA- R685
Superantigenic core, consistently aligned against bacterial or viral SAgs
