
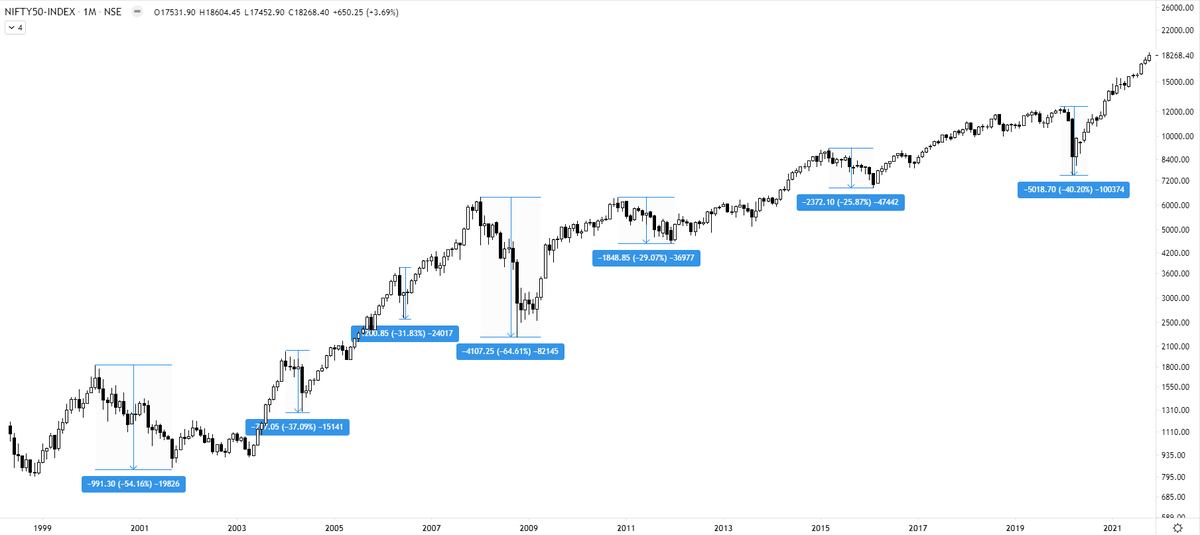
7 times since 1998, we had a fall of more than 25% on Index level.
The min and max time period b/w 2 subsequent falls was 16 months & 45 months.
If you can not digest the fall of 25-40% once every 3-5 years, you shouldn't own stocks. Prepare for the worse & invest for the best
More from The_Chartist 📈

although a must-have portfolio stock. Faced resistance right at the upper channel boundary. Volumes high. Any retracement back to the lower boundary will be an opportunity to accumulate. https://t.co/5uDsUXsbPP
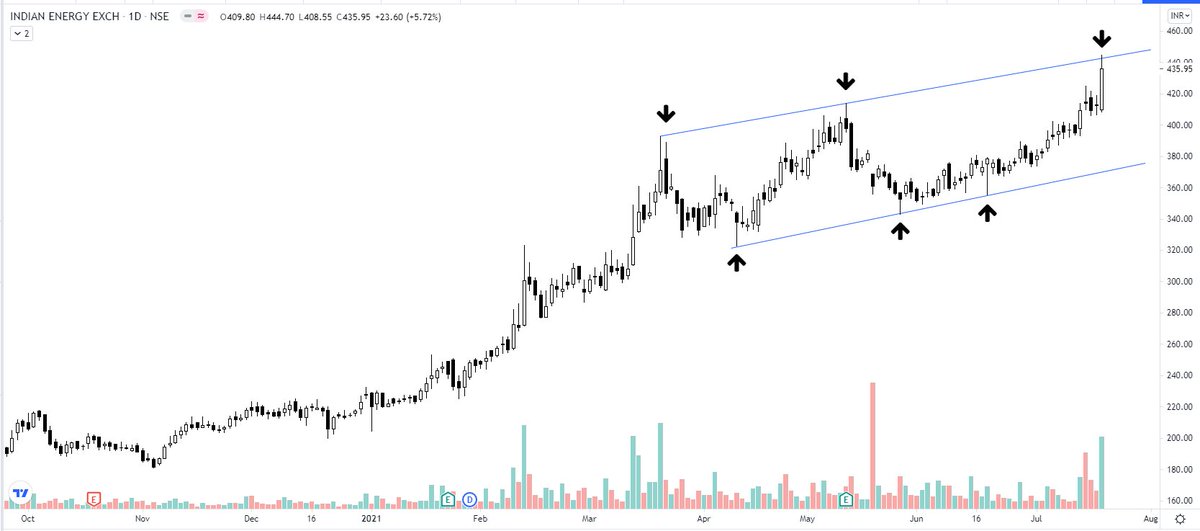
IEX - the resistance turning support. Kindly review, please. @nishkumar1977 @suru27 @rohanshah619 @indian_stockss @sanstocktrader @BissaGauravB @RajarshitaS @PAVLeader @Rishikesh_ADX @VijayThk @Investor_Mohit @TrendTrader85 pic.twitter.com/7CCzmee5If
— Steve Nison (@nison_steve) December 18, 2020
You May Also Like


Decoded his way of analysis/logics for everyone to easily understand.
Have covered:
1. Analysis of volatility, how to foresee/signs.
2. Workbook
3. When to sell options
4. Diff category of days
5. How movement of option prices tell us what will happen
1. Keeps following volatility super closely.
Makes 7-8 different strategies to give him a sense of what's going on.
Whichever gives highest profit he trades in.
I am quite different from your style. I follow the market's volatility very closely. I have mock positions in 7-8 different strategies which allows me to stay connected. Whichever gives best profit is usually the one i trade in.
— Sarang Sood (@SarangSood) August 13, 2019
2. Theta falls when market moves.
Falls where market is headed towards not on our original position.
Anilji most of the time these days Theta only falls when market moves. So the Theta actually falls where market has moved to, not where our position was in the first place. By shifting we can come close to capturing the Theta fall but not always.
— Sarang Sood (@SarangSood) June 24, 2019
3. If you're an options seller then sell only when volatility is dropping, there is a high probability of you making the right trade and getting profit as a result
He believes in a market operator, if market mover sells volatility Sarang Sir joins him.
This week has been great so far. The main aim is to be in the right side of the volatility, rest the market will reward.
— Sarang Sood (@SarangSood) July 3, 2019
4. Theta decay vs Fall in vega
Sell when Vega is falling rather than for theta decay. You won't be trapped and higher probability of making profit.
There is a difference between theta decay & fall in vega. Decay is certain but there is no guaranteed profit as delta moves can increase cost. Fall in vega on the other hand is backed by a powerful force that sells options and gives handsome returns. Our job is to identify them.
— Sarang Sood (@SarangSood) February 12, 2020
