
Siemens India
Rectangle target open is 2880 https://t.co/uELR7H2YA4
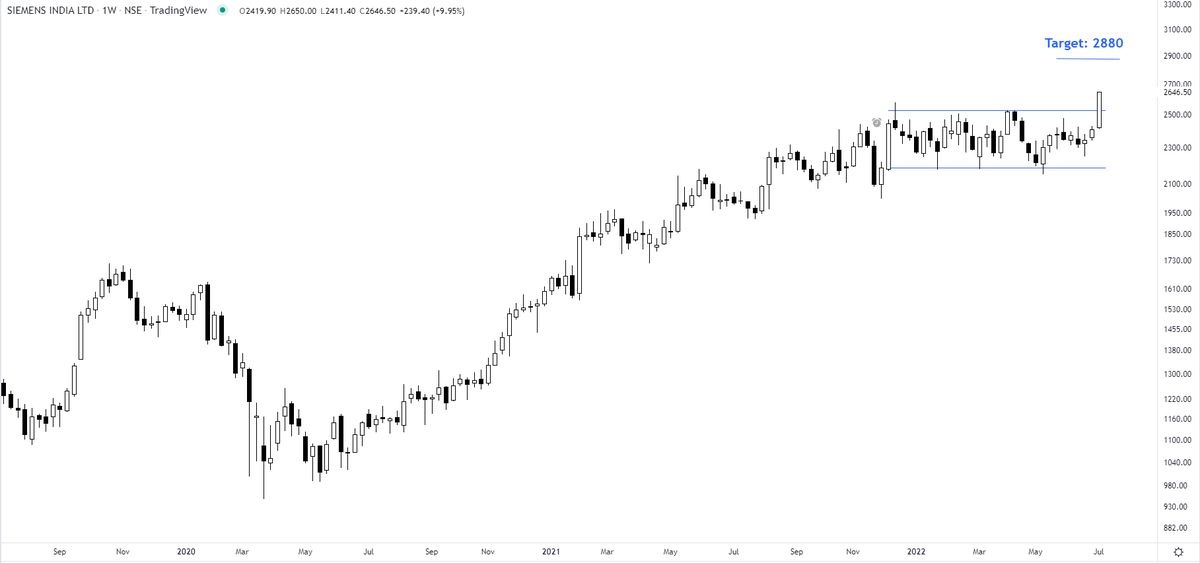
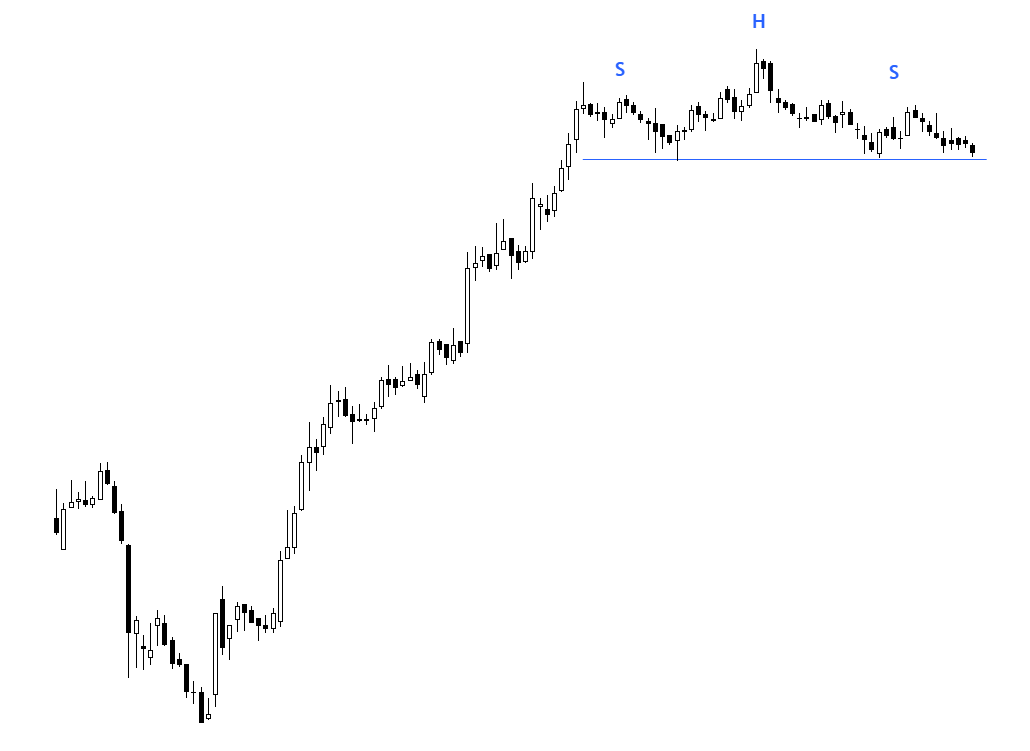
Siemens India - strong bullish candles are the early indicators of a bullish breakout.
— The_Chartist \U0001f4c8 (@charts_zone) July 5, 2022
Rectangle pic.twitter.com/88XzecpEWx
More from The_Chartist 📈
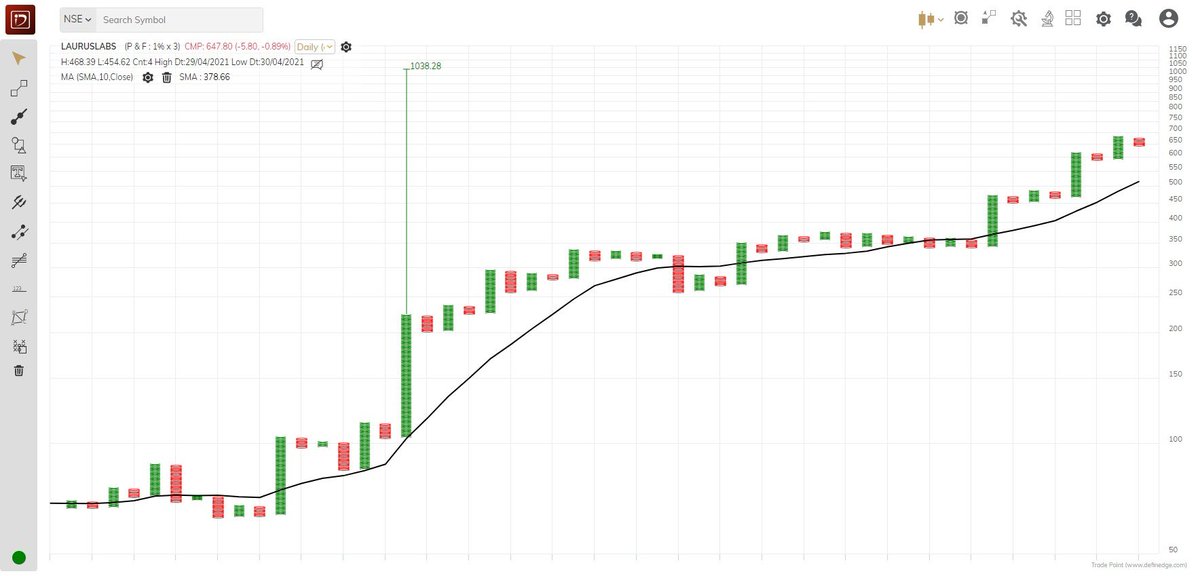
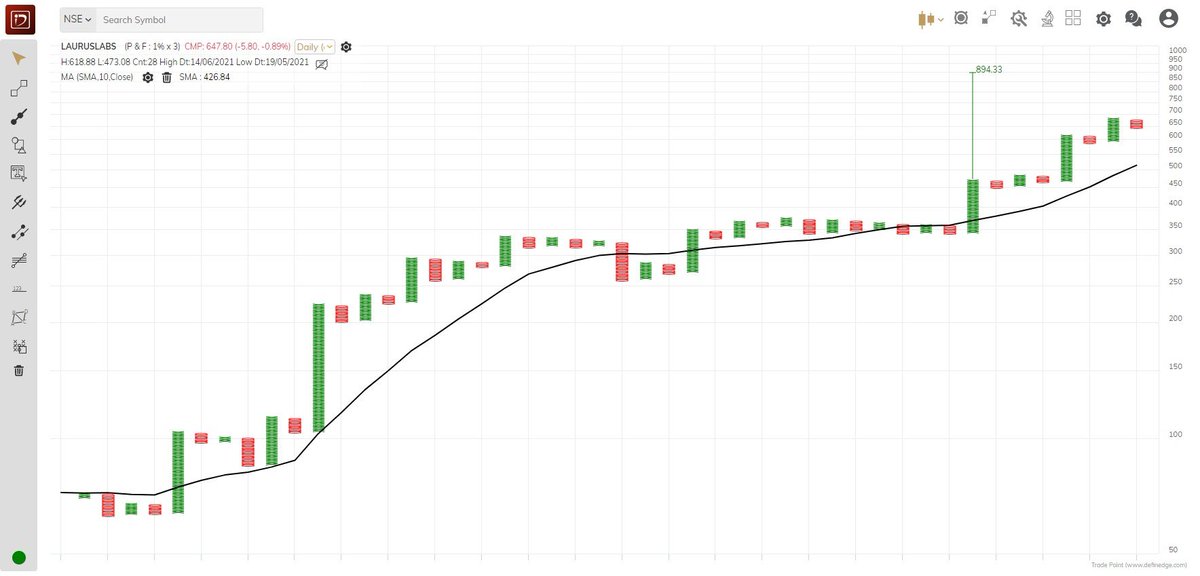
Explained you same concept with Elxsi. The real test of a strong Breakout is that the big hand will not give you another chance to buy the share at the breakout level. They will absorb all the selling of weak hands. I mean "STRONG breakout". https://t.co/7fxFqGQl3p
Tata Elxsi ---
— Steve Nison (@nison_steve) June 30, 2021
In the last 10 minutes, all the selling was absorbed despite intraday positions being squared off (if not converted). will wait for the EOD data. However, the chart structure is extremely strong. https://t.co/pci7GCDBEO pic.twitter.com/1NBD9V3mKc

This exercise will tell you about your inherent strengths & weaknesses. 👇👇
How to record a trading journal (TJ) & what to analyze?
— The_Chartist \U0001f4c8 (@charts_zone) December 14, 2021
What is in a TJ?
Buy Date
Stock Name
The time frame you analyzed (D/W/M)
Long/Short?
Buy Price
SL
Sell Price
Risk took (% of capital)
Sell date
No. of days held
P/L
P/L as % of capital
Buy Reason?
Invested capital/trade pic.twitter.com/WnrvmYuOV0
You May Also Like

i wonder if you can make a thread bout witchcraft in malaysia.. or list of our own local gods/deites..
— r a y a \U0001f319 (@lcvelylilith) February 20, 2020
Before I begin, it might be worth explaining the Malay conception of the spirit world. At its deepest level, Malay religious belief is animist. All living beings and even certain objects are said to have a soul. Natural phenomena are either controlled by or personified as spirits
Although these beings had to be respected, not all of them were powerful enough to be considered gods. Offerings would be made to the spirits that had greater influence on human life. Spells and incantations would invoke their
Animist ceremonies of a religious or magical nature were normally held for the purpose of divination or making a request. This would either be done at a keramat or at a shrine similar to the Thai spirit houses or Chinese roadside shrines pic.twitter.com/I1hliyi0x3
— \u2745\u1710\u170b\u1713\u170e (@uglyluhan) June 16, 2019
Two known examples of such elemental spirits that had god-like status are Raja Angin (king of the wind) and Mambang Tali Arus (spirit of river currents). There were undoubtedly many more which have been lost to time
Contact with ancient India brought the influence of Hinduism and Buddhism to SEA. What we now call Hinduism similarly developed in India out of native animism and the more formal Vedic tradition. This can be seen in the multitude of sacred animals and location-specific Hindu gods


One thing I've been noticing about responses to today's column is that many people still don't get how strong the forces behind regional divergence are, and how hard to reverse 1/ https://t.co/Ft2aH1NcQt
— Paul Krugman (@paulkrugman) November 20, 2018
See this thing that @lymanstoneky wrote:
And see this thing that I wrote:
And see this book that @JamesFallows wrote:
And see this other thing that I wrote: