
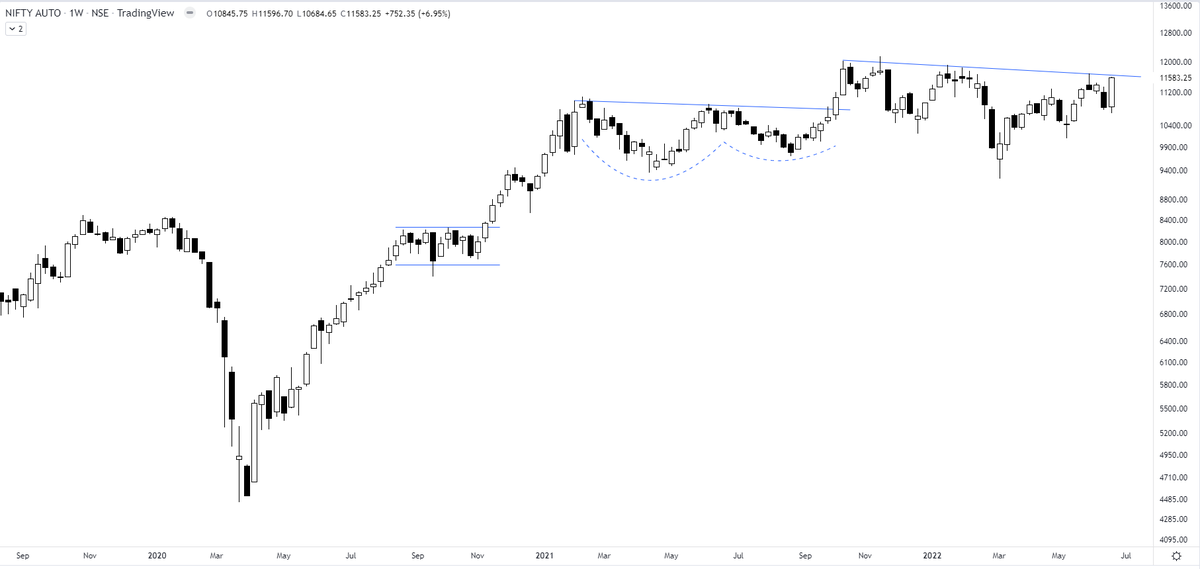
Especially when a lot of stocks have flown higher & the index is near resistance, I would be observing the chart closely if it breaks out all of a sudden or retraces back a bit. If it is a retracement - that would give another opportunity to trade a few auto names.
Nifty Auto
More from The_Chartist 📈
It is important to analyse the strength of the breakout. If the price does not continues the move in 1 or 2 sessions and candles show long upper wicks, it is better to bring the SL closer. Distribution sign.
Will be helpful in next breakouts. https://t.co/AtZOj4bKeT
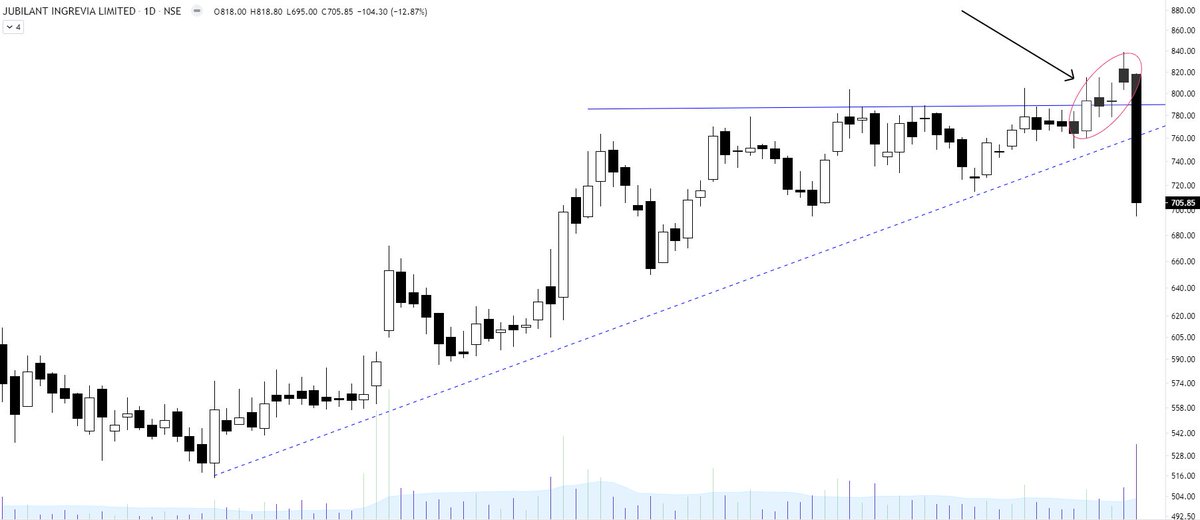
Learning: Strong breakout
— The_Chartist \U0001f4c8 (@nison_steve) July 2, 2021
1. Breakout candle will have no upper shadow or extremely less compared to the body
2. Volumes will be high (to avoid retailers to enter & also big hand absorbing all the selling)
3. Pullbacks will be rare/very less
4. Happens after a long consolidation pic.twitter.com/YTHDOnEdxo

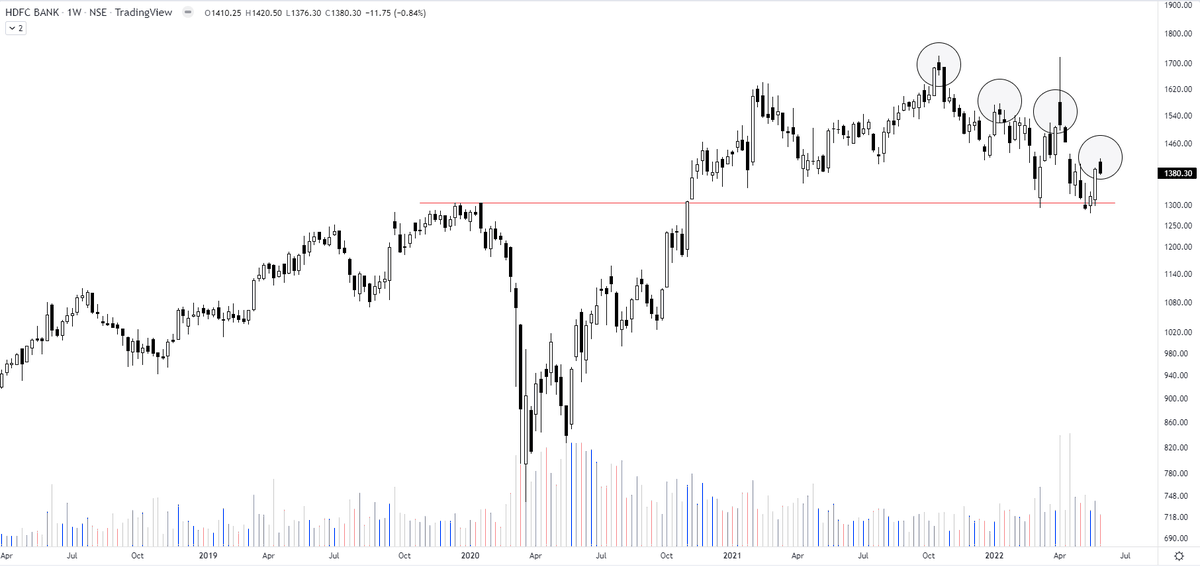
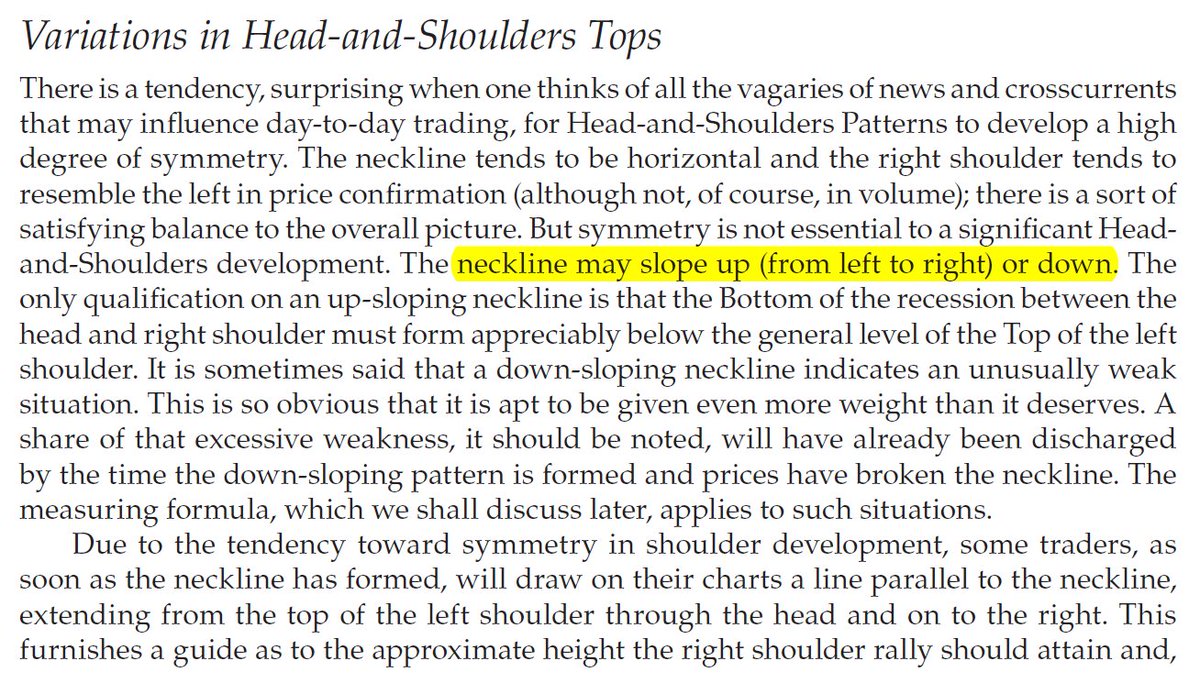
Sir Edwards & Magee discussed sloping necklines in H&S in their classical work. I am considering this breakdown by Affle as an H&S top breakdown with a target open of 770.
— The_Chartist \U0001f4c8 (@charts_zone) May 25, 2022
The target also coincides with support at the exact same level. pic.twitter.com/n84kSgkg4q
You May Also Like


Always. No, your company is not an exception.
A tactic I don’t appreciate at all because of how unfairly it penalizes low-leverage, junior employees, and those loyal enough not to question it, but that’s negotiation for you after all. Weaponized information asymmetry.
Listen to Aditya
"we don't negotiate salaries" really means "we'd prefer to negotiate massive signing bonuses and equity grants, but we'll negotiate salary if you REALLY insist" https://t.co/80k7nWAMoK
— Aditya Mukerjee, the Otterrific \U0001f3f3\ufe0f\u200d\U0001f308 (@chimeracoder) December 4, 2018
And by the way, you should never be worried that an offer would be withdrawn if you politely negotiate.
I have seen this happen *extremely* rarely, mostly to women, and anyway is a giant red flag. It suggests you probably didn’t want to work there.
You wish there was no negotiating so it would all be more fair? I feel you, but it’s not happening.
Instead, negotiate hard, use your privilege, and then go and share numbers with your underrepresented and underpaid colleagues. […]


1 - open trading view in your browser and select stock scanner in left corner down side .
2 - touch the percentage% gain change ( and u can see higest gainer of today)
Making thread \U0001f9f5 on trading view scanner by which you can select intraday and btst stocks .
— Vikrant (@Trading0secrets) October 22, 2021
In just few hours (Without any watchlist)
Some manual efforts u have to put on it.
Soon going to share the process with u whenever it will be ready .
"How's the josh?"guys \U0001f57a\U0001f3b7\U0001f483
3. Then, start with 6% gainer to 20% gainer and look charts of everyone in daily Timeframe . (For fno selection u can choose 1% to 4% )
4. Then manually select the stocks which are going to give all time high BO or 52 high BO or already given.
5. U can also select those stocks which are going to give range breakout or already given range BO
6 . If in 15 min chart📊 any stock sustaing near BO zone or after BO then select it on your watchlist
7 . Now next day if any stock show momentum u can take trade in it with RM
This looks very easy & simple but,
U will amazed to see it's result if you follow proper risk management.
I did 4x my capital by trading in only momentum stocks.
I will keep sharing such learning thread 🧵 for you 🙏💞🙏
Keep learning / keep sharing 🙏
@AdityaTodmal