by a group friend

More from itrade(DJ)


More from Mplearnings

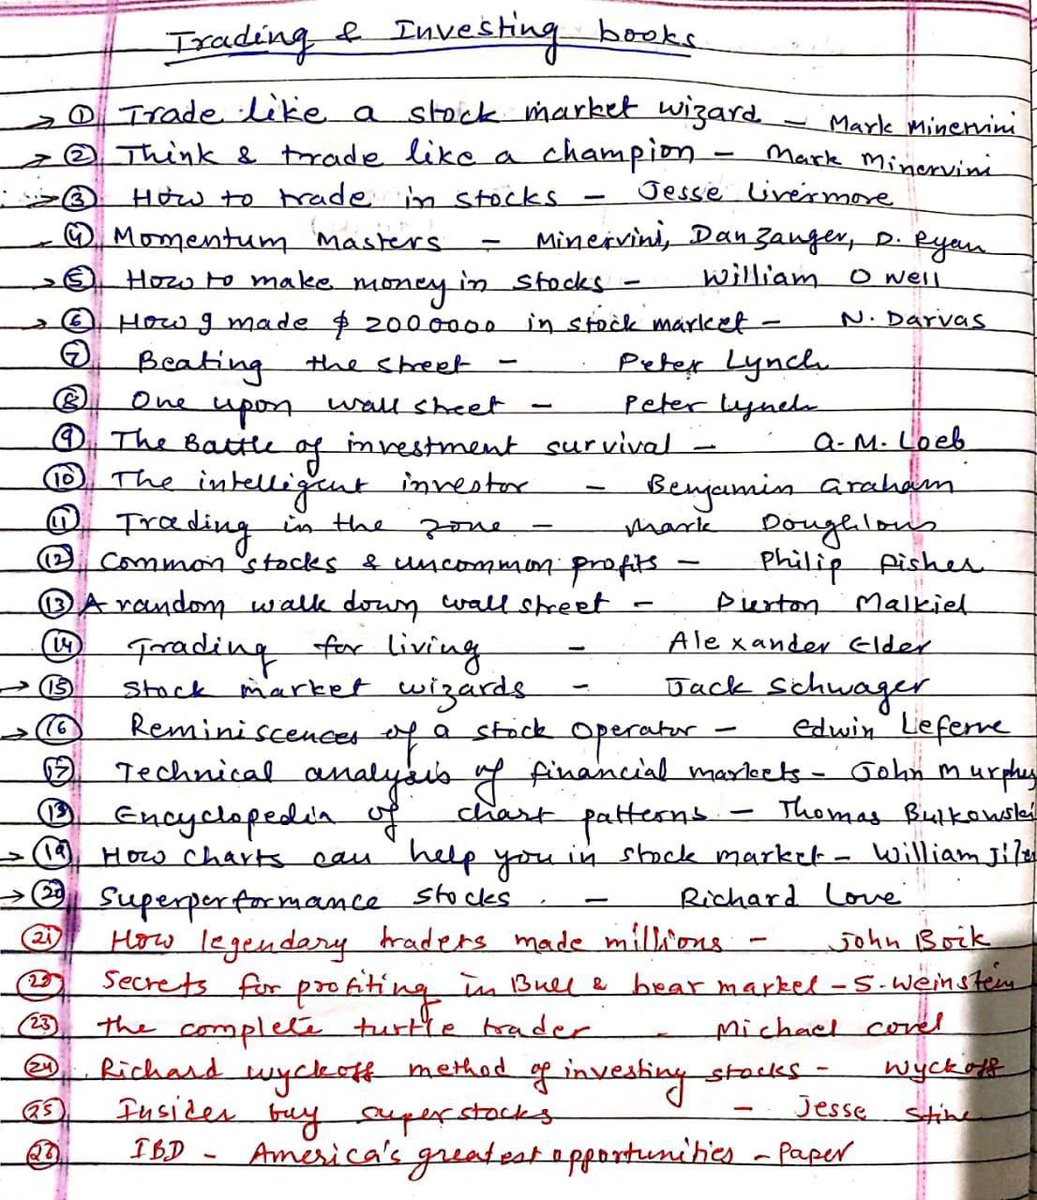
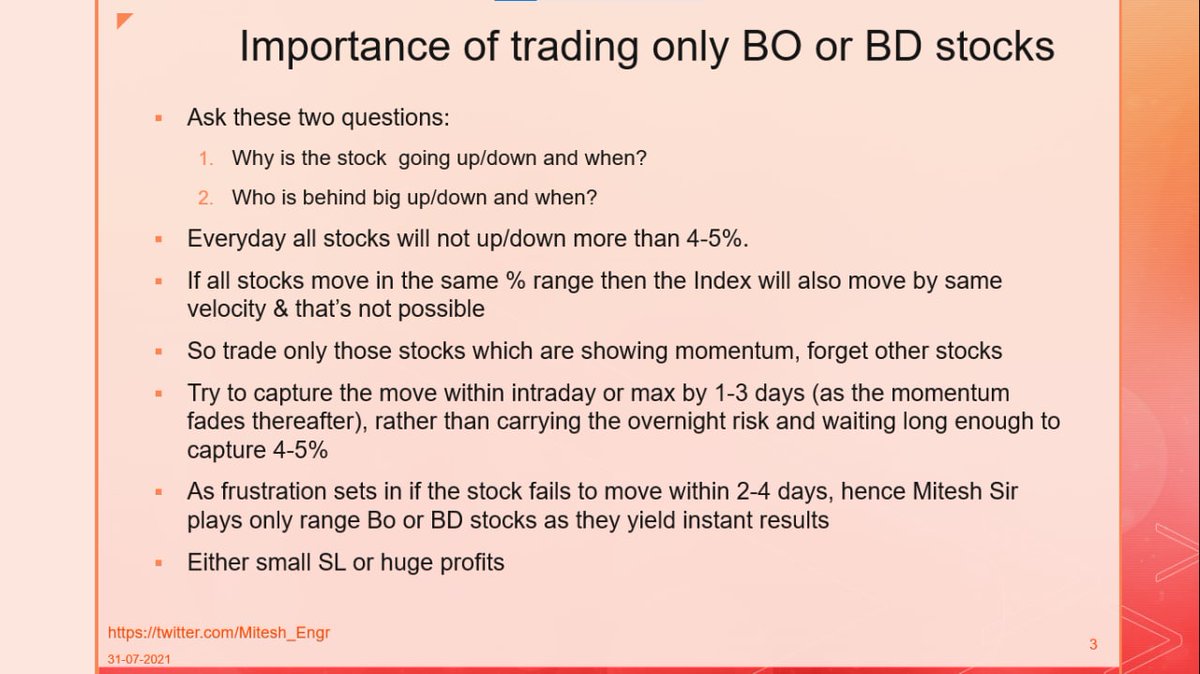
Read it and practice.
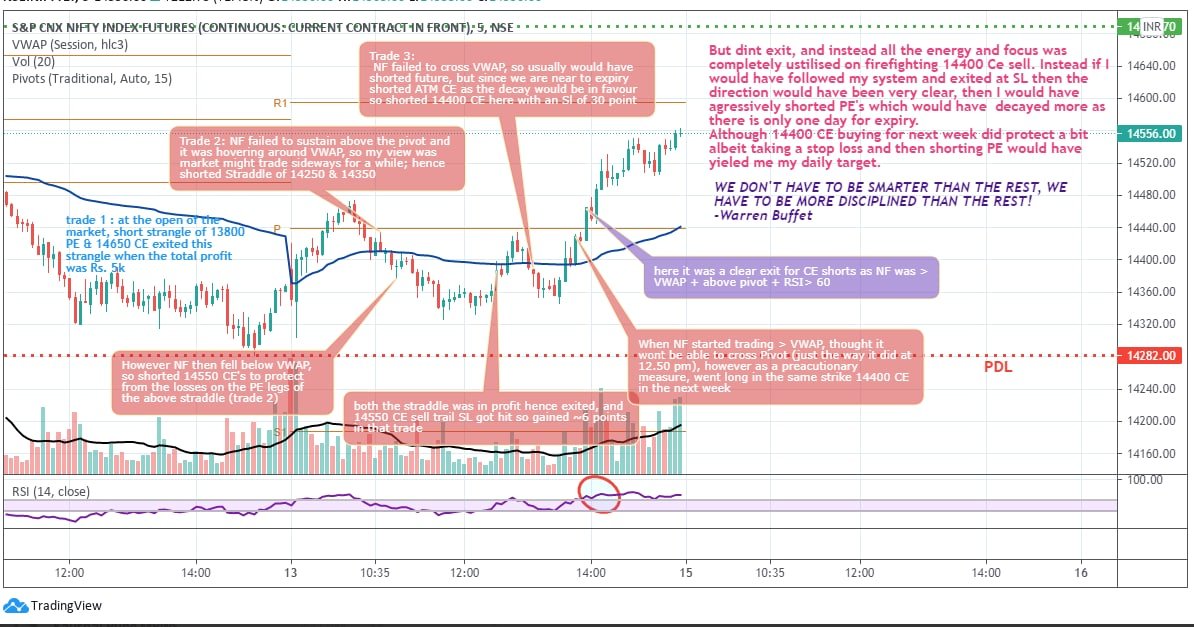
How I am playing expiry trades.
How I am playing expiry trades.
Catch me if you can @Mitesh_Engr
— Nikita Poojary (@niki_poojary) July 17, 2021
Time for a\U0001f9f5
Mitesh Sir's EXPIRY Option Selling 101:
\u2022 What to look for?
\u2022 Strike Selection & Ratios
\u2022 SL mgmt
\u2022 Avoiding freezes
\u2022 Monthy Expiry
\u2022 Event days
\u2022 How he would have traded last expiry?
In collaboration with @AdityaTodmal pic.twitter.com/9uN2vQQ4hc

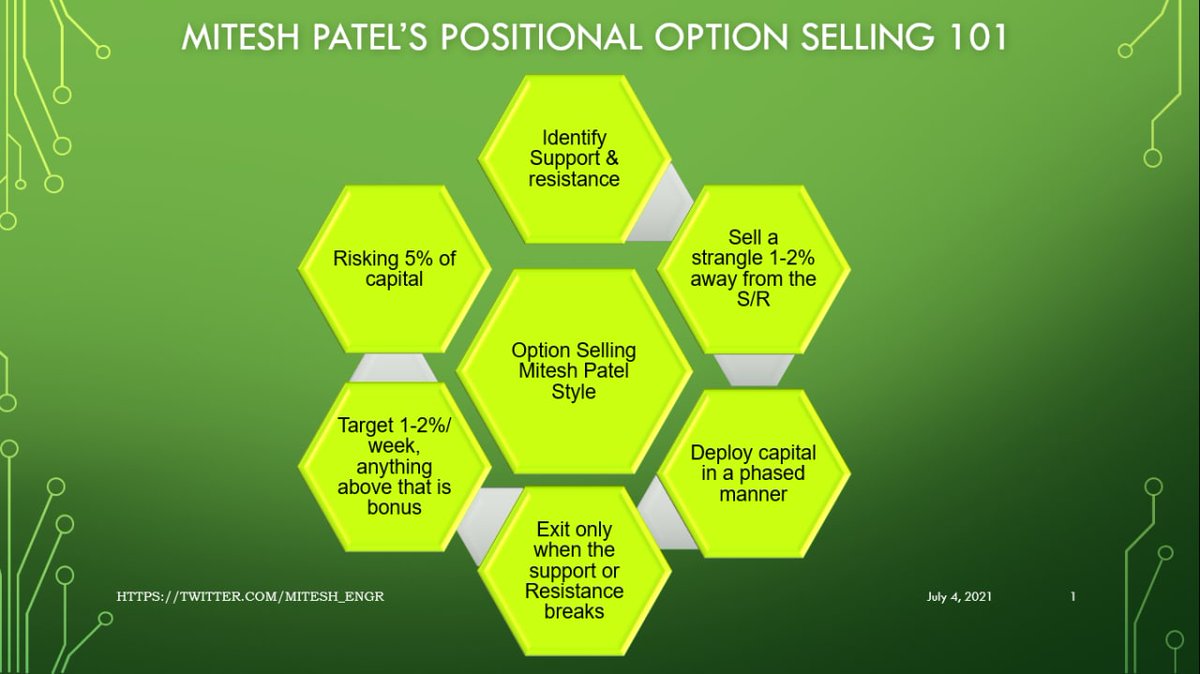


Never trade with loan amount.
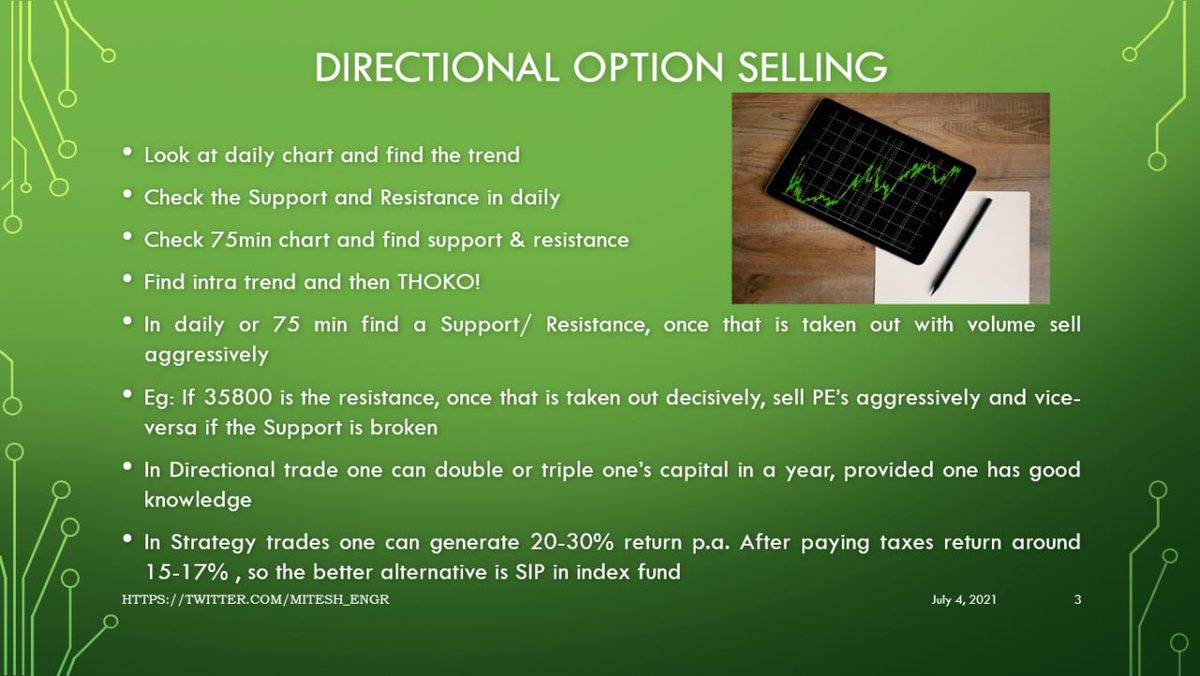
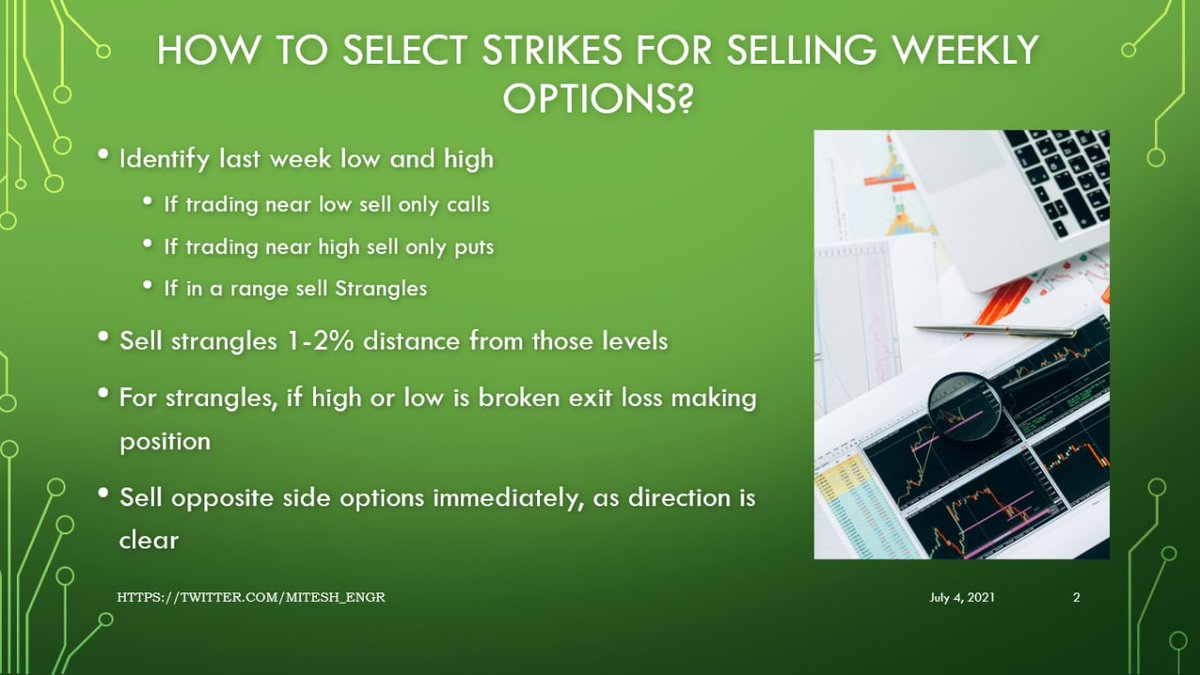
My trading is very simple. Selling option based on support and resistance. Time frame: Daily and 75 min.
Keep distance of 1-2% from S & R so one has chance to exit or adjust if trade goes against.
And last one my tgt is 4% pm. Above it bonus.
My trading is very simple. Selling option based on support and resistance. Time frame: Daily and 75 min.
Keep distance of 1-2% from S & R so one has chance to exit or adjust if trade goes against.
And last one my tgt is 4% pm. Above it bonus.
Dear Nitesh can you share some idea how you makes successful trade. Please I am in a big loss since I started my journey of stock market in 2017. Then I took 15 lac loan and everything is vanished. Now I am in so much struggle to pay the EMI
— Ganesh (@Eshan70302504) May 30, 2021
You May Also Like


1/OK, data mystery time.
This New York Times feature shows China with a Gini Index of less than 30, which would make it more equal than Canada, France, or the Netherlands. https://t.co/g3Sv6DZTDE
That's weird. Income inequality in China is legendary.
Let's check this number.
2/The New York Times cites the World Bank's recent report, "Fair Progress? Economic Mobility across Generations Around the World".
The report is available here:
3/The World Bank report has a graph in which it appears to show the same value for China's Gini - under 0.3.
The graph cites the World Development Indicators as its source for the income inequality data.

4/The World Development Indicators are available at the World Bank's website.
Here's the Gini index: https://t.co/MvylQzpX6A
It looks as if the latest estimate for China's Gini is 42.2.
That estimate is from 2012.
5/A Gini of 42.2 would put China in the same neighborhood as the U.S., whose Gini was estimated at 41 in 2013.
I can't find the <30 number anywhere. The only other estimate in the tables for China is from 2008, when it was estimated at 42.8.
This New York Times feature shows China with a Gini Index of less than 30, which would make it more equal than Canada, France, or the Netherlands. https://t.co/g3Sv6DZTDE
That's weird. Income inequality in China is legendary.
Let's check this number.
2/The New York Times cites the World Bank's recent report, "Fair Progress? Economic Mobility across Generations Around the World".
The report is available here:
3/The World Bank report has a graph in which it appears to show the same value for China's Gini - under 0.3.
The graph cites the World Development Indicators as its source for the income inequality data.
4/The World Development Indicators are available at the World Bank's website.
Here's the Gini index: https://t.co/MvylQzpX6A
It looks as if the latest estimate for China's Gini is 42.2.
That estimate is from 2012.
5/A Gini of 42.2 would put China in the same neighborhood as the U.S., whose Gini was estimated at 41 in 2013.
I can't find the <30 number anywhere. The only other estimate in the tables for China is from 2008, when it was estimated at 42.8.