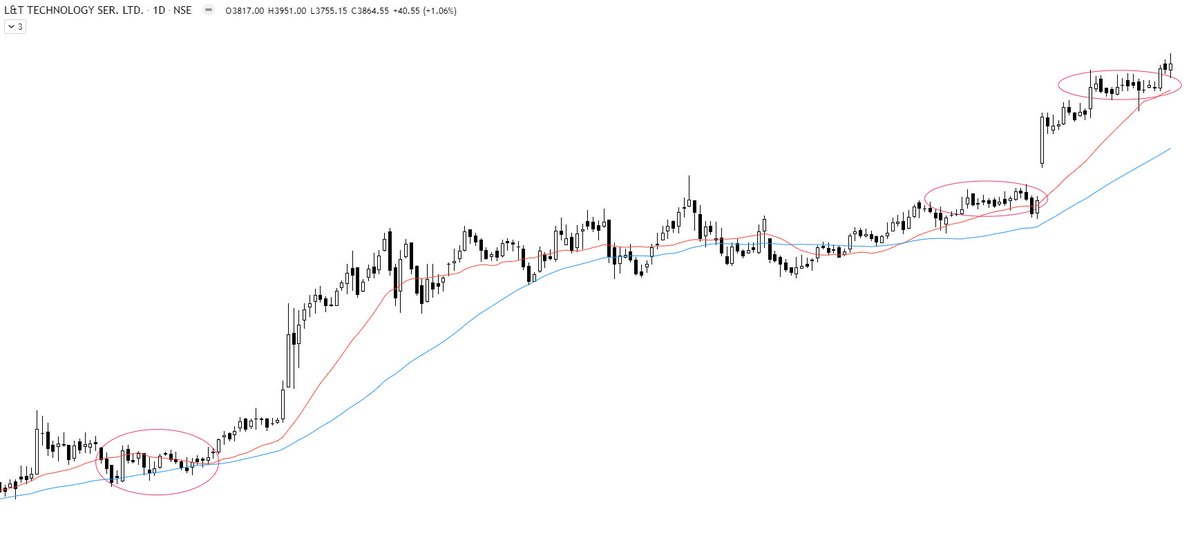
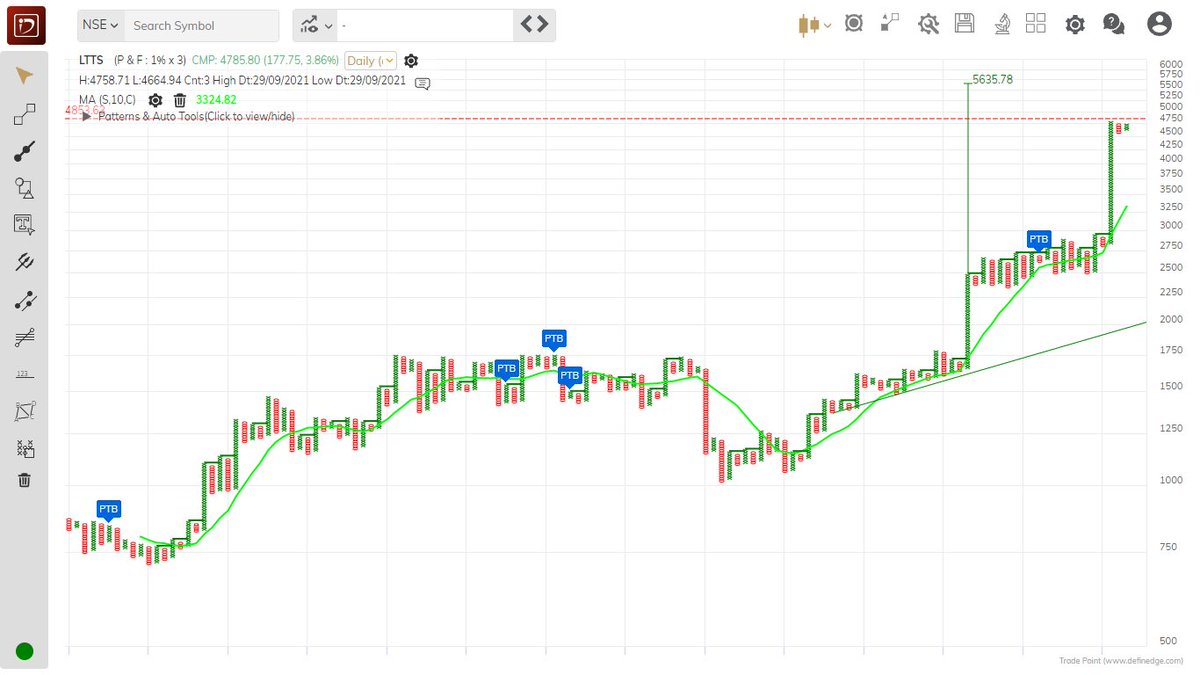
LTTS
Double Top Buy above 4854.36 daily close on 1% Box Size chart. https://t.co/KsAg2ZAwCF
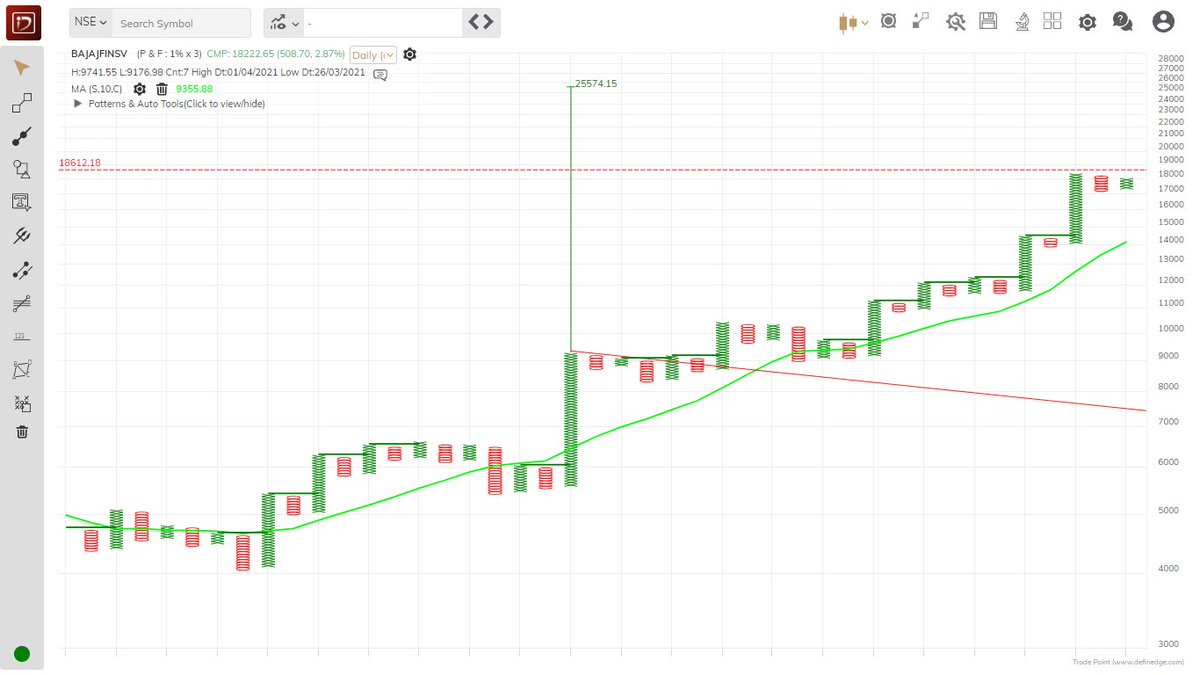
LTTS
— Saket Reddy (@saketreddy) March 2, 2021
Double Top Buy above 2753.05 daily close on 1% Box Size Chart and Double Top Buy active on 3% Box size chart. https://t.co/5VpG2455C2 pic.twitter.com/q0yZXgqatt
More from Saket Reddy
Don't try bottom fishing and value buying as time correction can take away a lot of opportunity cost.
Just let it give a monthly or weekly close above ATH.
ABBOTINDIA
— Saket Reddy (@saketreddy) May 8, 2021
A breakout in the offing? pic.twitter.com/rnpcsQ616a
Today's closing is a monthly close and this is done & dusted, we now have a solid monthly close above the 10 year supply zone.
If the stock has broken out from a 10 year supply zone & a 20 year peak, surely something would've changed!
Do study the industry structure! https://t.co/zA3qztFzon
SAREGAMA at a very important juncture now on the monthly chart considering today's close is also a monthly close.
— Saket Reddy (@saketreddy) May 31, 2021
Nearing a breakout from over a 10 year supply zone! https://t.co/qpsSn3obrE pic.twitter.com/1xTmB6WvhK
The Home Building Theme has just broadened itself and is moving in top gear!
The best ways to play the real estate revival theme instead of buying the home builders :-
— Saket Reddy (@saketreddy) November 21, 2020
1. Ceramics (CERA, KAJARIA)
2. Pipes (ASTRAL, SUPREME, APLAPOLLO)
3. Paints (ASIAN, BERGER)
4. Cement (JKCEM, SHREEC)
5. Construction Chemicals (PIDILITE)
6. Electricals (POLYCAB, HAVELLS)
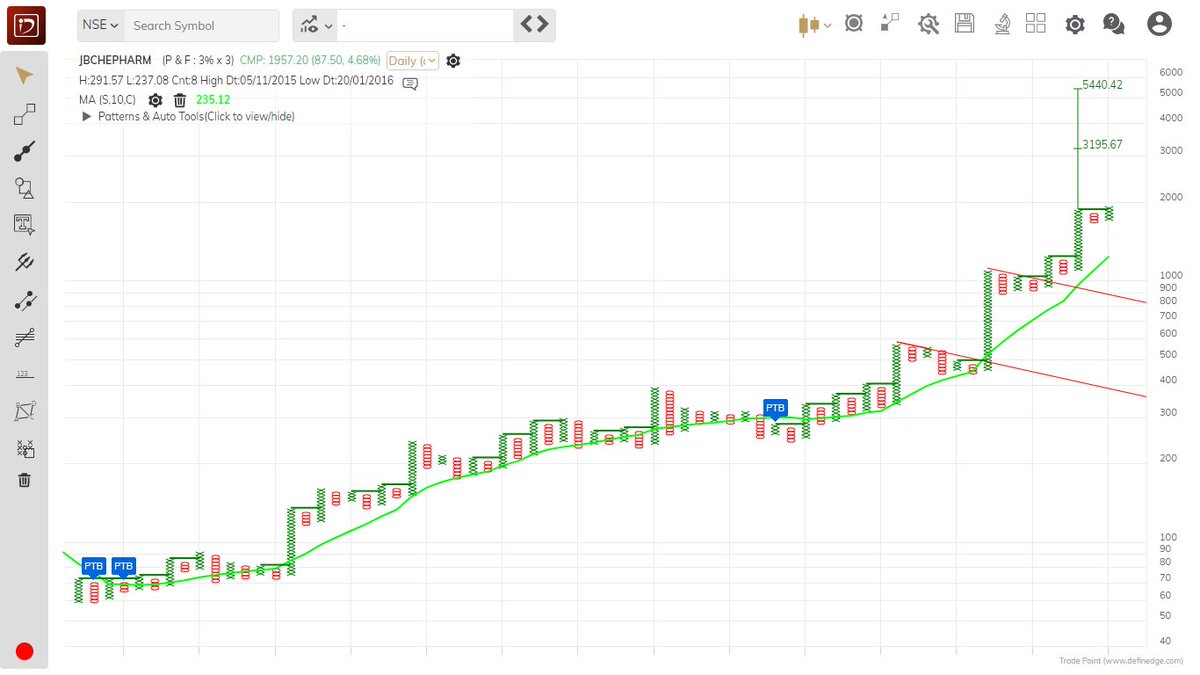
Double Top Buy triggered above 1933.43 daily close on 3% Box size chart. https://t.co/eELxOeNmvg
JBCHEPHARM
— Saket Reddy (@saketreddy) July 16, 2021
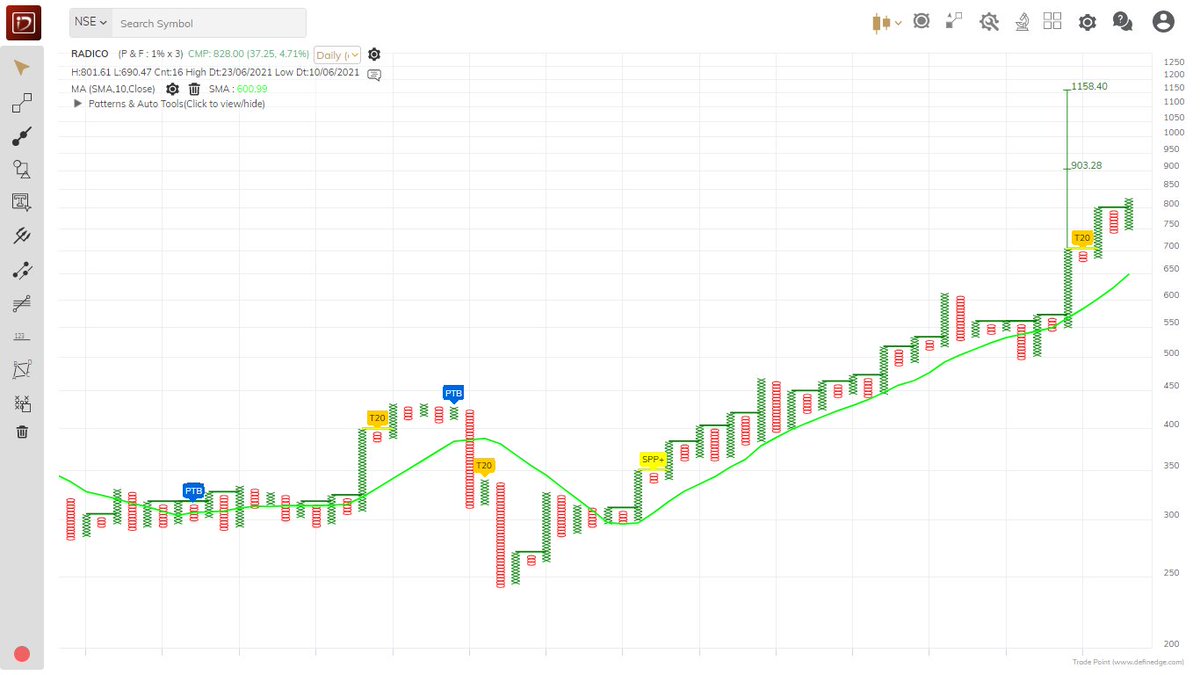
Double Top Buy, Super Pattern - Bullish and T20 Pattern - Bullish triggered above 1886.26 daily close on 1% Box Size chart. https://t.co/bzIsbWjbEP pic.twitter.com/JQVkao635V
More from Ltts
#LLTS Weekly chart shows the stock is recovering from 61.8% fibonacci pullback of last major rise
— Techno Prince (@Trader_souradep) July 24, 2022
Daily chart shows a a rounding bottom , daily RSI bullish
If it sustains above 3500 it can move towards 3900+ levels and later towards 200 DMA 4480#Nifty pic.twitter.com/6ebtfLMJZd