Prepping for today's thread, the story of the CURRENT CYBERWAR is clearly overwhelming. J.E. Dyer @OptimisticCon links us to this story. Just one quote to
More from Pasquale "Pat" Scopelliti
19 December 2020 #MAGAanalysis #OVERTURN
The Signals Are Accelerating And Strengthening
I consider the tweet below the most important yet. We'll immediately discuss why below. After that there are two documents and an interview to work on. Clarity is arising, pointing the way.
2) I was about to laugh about the dispute warning, but then realized that this very act on Twitter's part is that grain of sand inside which you can see the entire world of what we face today. How dare they? How dare you Twitter? Who, WHAT do you think you are?

3) We have to consider the logic. Stave Navarro releases a report. It is published at Bannon's War Room. In these matters, tone is everything. It might have been published anywhere but the President, I mean Navarro, chose to publish with
4) That is a signal. Why Steve? Beyond the clear statement of unity - Steve is a full member of the strategic team working to save our nation - there is a far deeper, more important reason. Steve's main portfolio item is China. Choosing him speaks them as much as us. Maybe more.
5) Bullies are cowards. One of the greatest means of PREVENTING war is the bold, direct, aggressive communication of readiness. You want a piece of this? Come get it...expletives deleted. There's always the other hand. War may be coming.
The Signals Are Accelerating And Strengthening
I consider the tweet below the most important yet. We'll immediately discuss why below. After that there are two documents and an interview to work on. Clarity is arising, pointing the way.
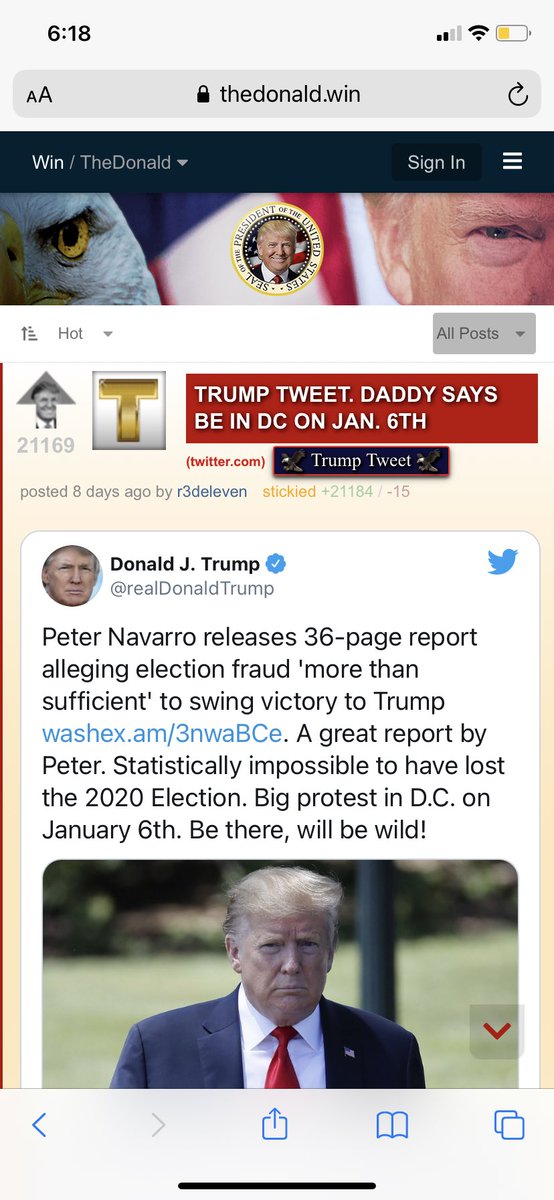
Peter Navarro releases 36-page report alleging election fraud 'more than sufficient' to swing victory to Trump https://t.co/D8KrMHnFdK. A great report by Peter. Statistically impossible to have lost the 2020 Election. Big protest in D.C. on January 6th. Be there, will be wild!
— Donald J. Trump (@realDonaldTrump) December 19, 2020
2) I was about to laugh about the dispute warning, but then realized that this very act on Twitter's part is that grain of sand inside which you can see the entire world of what we face today. How dare they? How dare you Twitter? Who, WHAT do you think you are?
3) We have to consider the logic. Stave Navarro releases a report. It is published at Bannon's War Room. In these matters, tone is everything. It might have been published anywhere but the President, I mean Navarro, chose to publish with
4) That is a signal. Why Steve? Beyond the clear statement of unity - Steve is a full member of the strategic team working to save our nation - there is a far deeper, more important reason. Steve's main portfolio item is China. Choosing him speaks them as much as us. Maybe more.
5) Bullies are cowards. One of the greatest means of PREVENTING war is the bold, direct, aggressive communication of readiness. You want a piece of this? Come get it...expletives deleted. There's always the other hand. War may be coming.
3 January 2020 #MAGAanalysis #Overturn
We MUST Bend Congress to OUR Will
We'll watch Madison's amazing video very carefully together below. Alone with a few general comments, we have three other sources to consider today as well. But watch Madison first, in full.
We MUST Bend Congress to OUR Will
We'll watch Madison's amazing video very carefully together below. Alone with a few general comments, we have three other sources to consider today as well. But watch Madison first, in full.
This is why I am OBJECTING to the 2020 election results.
— Madison Cawthorn (@CawthornforNC) December 31, 2020
The right to vote in a free and fair election is the cornerstone of our Republic. Attempts to undermine this strike at the very heart of a representative government \u201cof, by, and for the People.\u201d
I will not be silent. pic.twitter.com/MbQX9lTfQ6