
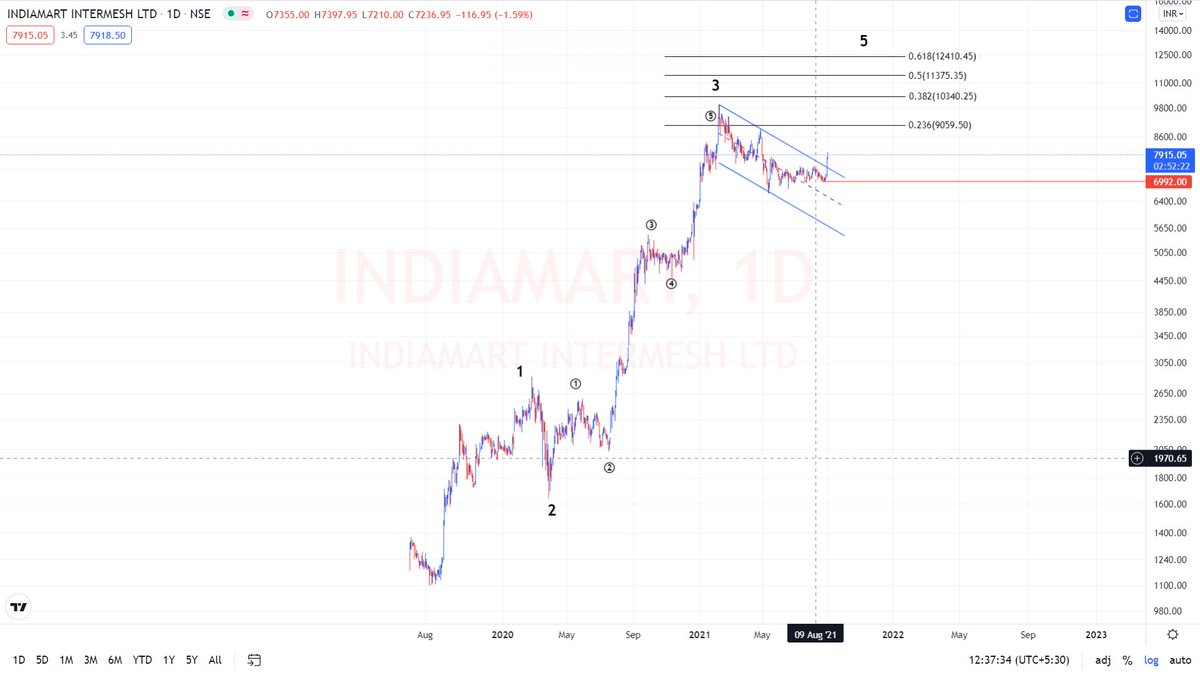
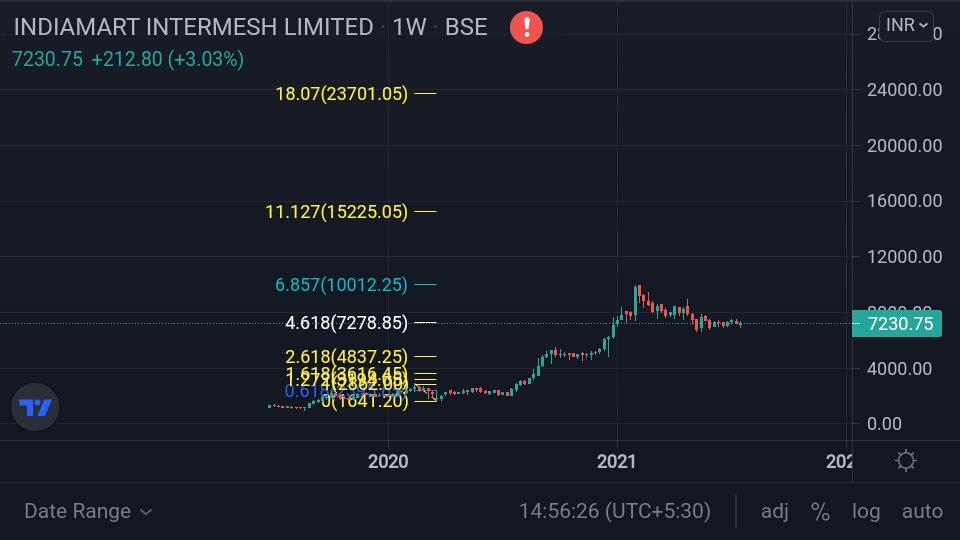
#indiamart #elliottwave update : cmp 7915 pattern gets failed below 6990 upside possible 10340—11375—12410 as wave—5 targets
#elliottwave
More from MD&ABN STOCKS TRADING IDEAS
More from Indiamart

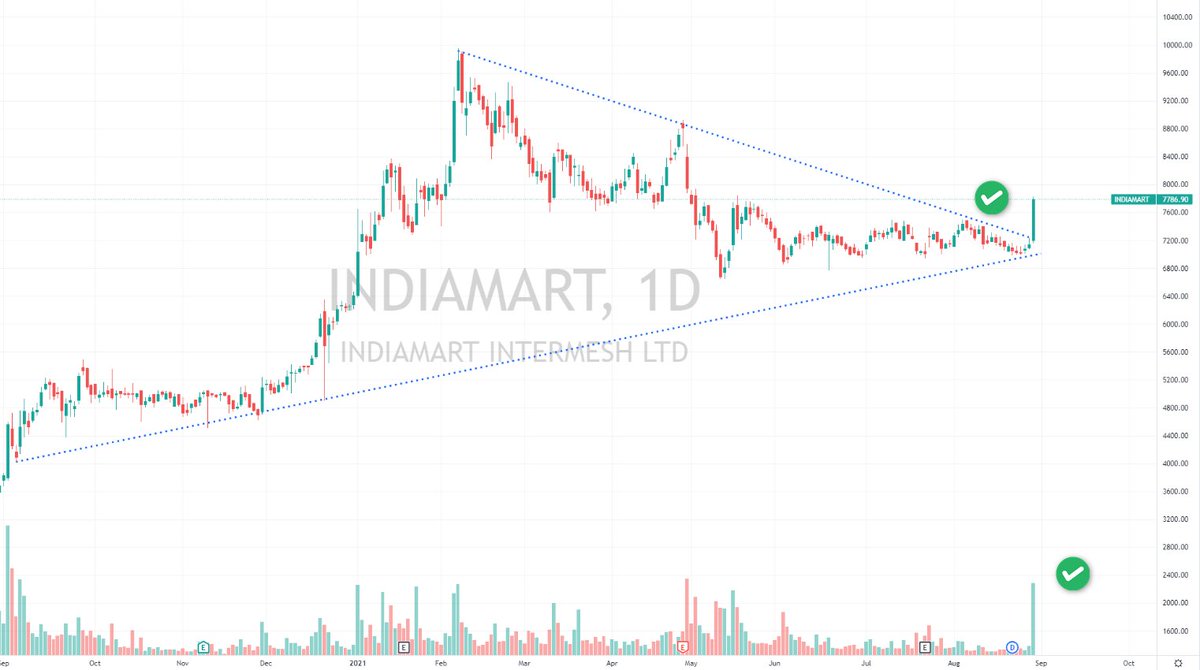
#Indiamart update - Above 7420, this one could rock - keep an eye. Narrow consolidation in price and time https://t.co/rkwehCnNY8

#Indiamart Update : The correction in the stock could be over. Stock holding good supports. Watch for upside momentum as #Unlock plays out. My SL here would be 6650 levels#Dare2Drm pic.twitter.com/JLwujVPcl0
— Dare2Dream (@Dare2Dr10109801) June 13, 2021
#Indiamart - Did see what i just saw? Something about to happen here @caniravkaria https://t.co/gk8LUD0Qlu

Good morning & thank you everyone for ur wishes & blessings\U0001f64f
— Nirav S. Karia (@caniravkaria) June 19, 2021
Feeling better now as took Dolo 650 but my hand is paining a lot. (huge consumption of Dolo 650 which is manufactured by Micro Labs Ltd unlisted\U0001f600).
But one mentioned in image is really worth studying \U0001f4da\U0001f4d6 ahead \U0001f64f https://t.co/yyrkNyRGAx pic.twitter.com/MijZmCXPMQ


You May Also Like


BREAKING: @CommonsCMS @DamianCollins just released previously sealed #Six4Three @Facebook documents:
Some random interesting tidbits:
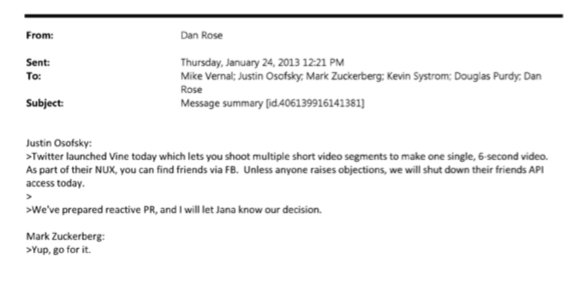
1) Zuck approves shutting down platform API access for Twitter's when Vine is released #competition
2) Facebook engineered ways to access user's call history w/o alerting users:
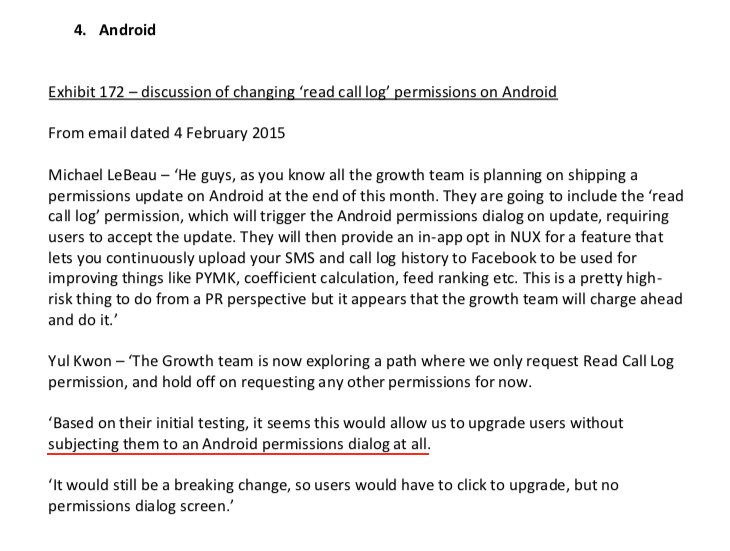
Team considered access to call history considered 'high PR risk' but 'growth team will charge ahead'. @Facebook created upgrade path to access data w/o subjecting users to Android permissions dialogue.
3) The above also confirms @kashhill and other's suspicion that call history was used to improve PYMK (People You May Know) suggestions and newsfeed rankings.
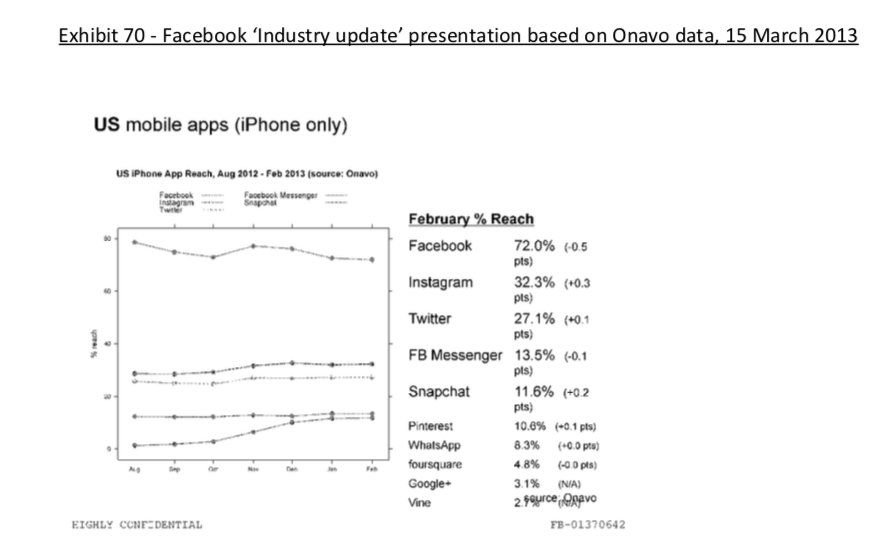
4) Docs also shed more light into @dseetharaman's story on @Facebook monitoring users' @Onavo VPN activity to determine what competitors to mimic or acquire in 2013.
https://t.co/PwiRIL3v9x
Some random interesting tidbits:
1) Zuck approves shutting down platform API access for Twitter's when Vine is released #competition
2) Facebook engineered ways to access user's call history w/o alerting users:
Team considered access to call history considered 'high PR risk' but 'growth team will charge ahead'. @Facebook created upgrade path to access data w/o subjecting users to Android permissions dialogue.
3) The above also confirms @kashhill and other's suspicion that call history was used to improve PYMK (People You May Know) suggestions and newsfeed rankings.
4) Docs also shed more light into @dseetharaman's story on @Facebook monitoring users' @Onavo VPN activity to determine what competitors to mimic or acquire in 2013.
https://t.co/PwiRIL3v9x