Prasanna Venkatesa Perumal #temple -Gunaseelam,Near Trichy,TN #Thread
Gunaseela Mahatmyam,a chapter of Bhavishyottara Purana describes greatness of this place.
Venkatachlapathi of Tirumala Tirupati appeared b4 Gunaseela Rishi here,so Gunaseelam is known as Ten(South)Tirupati
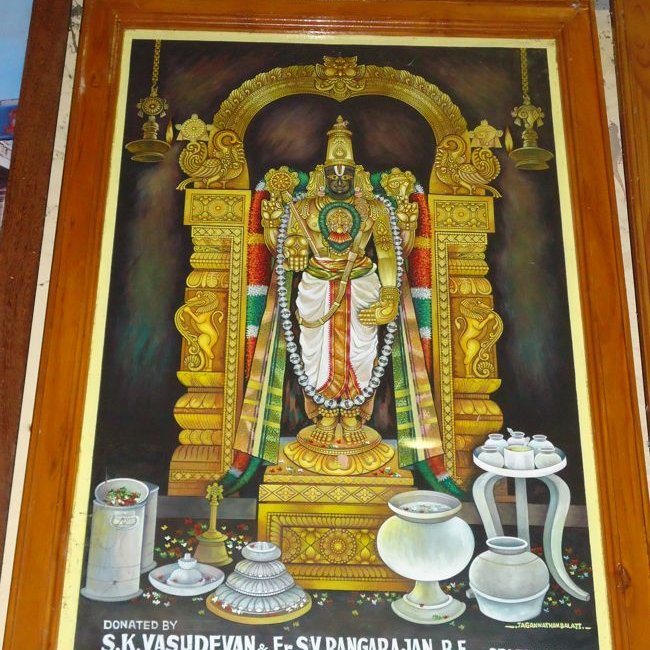
Prasanna Venkatesa Perumal is in a standing posture with 4 arms holding sankha & chakra in the upper hands.The lower right hand is in abhaya pose,blessing devotees &left hand is in kati hasta,resting on waist.
A sceptre(senkkol)rests on right shoulder,with which this murti is believed to cure people affected by mental illness.These patient stay here for a period-48 days& participate in poojas&most of them get relieved of their problems.There is a temple run Mental Rehabilitation center
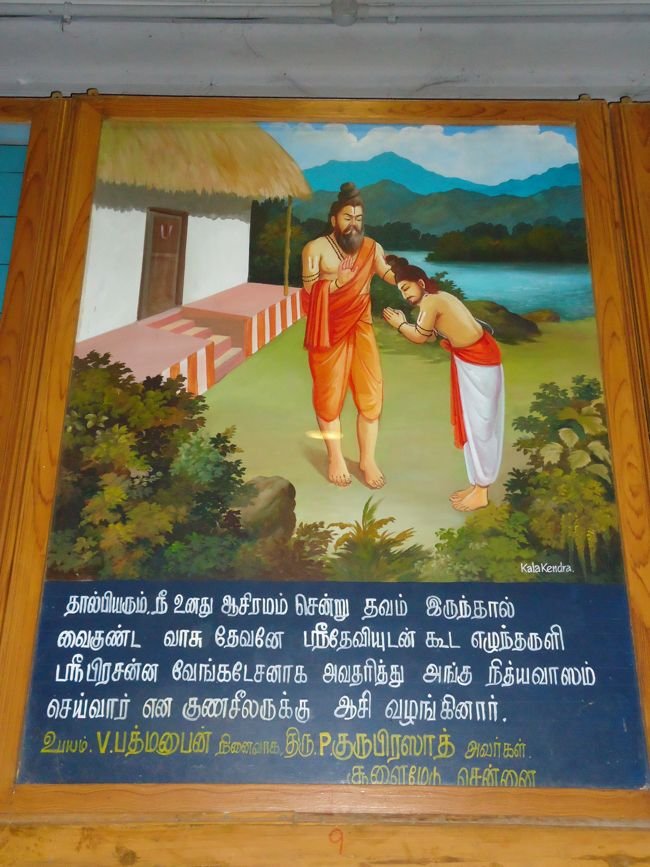
#storytimethread -As per Sthala Puranam,existence of this temple is due to efforts of Gunaseela Rishi, a disciple of Thalpiya Maharishi.
Thalpiya Maharishi along with his disciple Gunaseela Rishi once went to Himalayas.On his way back, Gunaseela Rishi stayed back at Tirupathi.
He was so wanted to have darshan of Venkatachalapathy in Gunaseelam near his asharam & bless the devotees.
He came back, bathed in the Cauvery,took blessing from his guru &undertook severe penance here in his ashram in Gunaseelam.