
This Day in Labor History: February 14, 1940. A group of Navajos write a letter of protest against the livestock reduction program the government forced upon them. Let's talk about how the New Deal transformed Navajo work culture in a shockingly negative way.
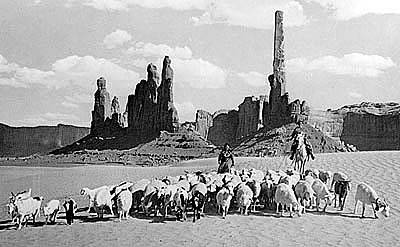
For instance, in our own district (No.3) the sheep unit is set at 282. If a person has 5 horses, that would be the equivalent to 25 sheep; 1 head of cattle is the equivalent of 4 sheep....
More from Erik Loomis


More from History

**Thread on Bravery of Sikhs**
(I am forced to do this due to continuous hounding of Sikh Extremists since yesterday)
Rani Jindan Kaur, wife of Maharaja Ranjit Singh had illegitimate relations with Lal Singh (PM of Ranjit Singh). Along with Lal Singh, she attacked Jammu, burnt - https://t.co/EfjAq59AyI

Hindu villages of Jasrota, caused rebellion in Jammu, attacked Kishtwar.
Ancestors of Raja Ranjit Singh, The Sansi Tribe used to give daughters as concubines to Jahangir.

The Ludhiana Political Agency (Later NW Fronties Prov) was formed by less than 4000 British soldiers who advanced from Delhi and reached Ludhiana, receiving submissions of all sikh chiefs along the way. The submission of the troops of Raja of Lahore (Ranjit Singh) at Ambala.
Dabistan a contemporary book on Sikh History tells us that Guru Hargobind broke Naina devi Idol Same source describes Guru Hargobind serving a eunuch
YarKhan. (ref was proudly shared by a sikh on twitter)
Gobind Singh followed Bahadur Shah to Deccan to fight for him.

In Zafarnama, Guru Gobind Singh states that the reason he was in conflict with the Hill Rajas was that while they were worshiping idols, while he was an idol-breaker.
And idiot Hindus place him along Maharana, Prithviraj and Shivaji as saviours of Dharma.

(I am forced to do this due to continuous hounding of Sikh Extremists since yesterday)
Rani Jindan Kaur, wife of Maharaja Ranjit Singh had illegitimate relations with Lal Singh (PM of Ranjit Singh). Along with Lal Singh, she attacked Jammu, burnt - https://t.co/EfjAq59AyI
Tomorrow again same thing happens bcoz fudus like you are creating a narrative oh Khalistan. when farmers are asking MSP. (RSS ki tatti khane wale Kerni sena ke kutte).
— Ancient Economist (@_stock_tips) December 5, 2020
U kill sikhs in 1984 just politics. To BC low IQ fudu Saale entire history was politics.
Hindu villages of Jasrota, caused rebellion in Jammu, attacked Kishtwar.
Ancestors of Raja Ranjit Singh, The Sansi Tribe used to give daughters as concubines to Jahangir.
The Ludhiana Political Agency (Later NW Fronties Prov) was formed by less than 4000 British soldiers who advanced from Delhi and reached Ludhiana, receiving submissions of all sikh chiefs along the way. The submission of the troops of Raja of Lahore (Ranjit Singh) at Ambala.
Dabistan a contemporary book on Sikh History tells us that Guru Hargobind broke Naina devi Idol Same source describes Guru Hargobind serving a eunuch
YarKhan. (ref was proudly shared by a sikh on twitter)
Gobind Singh followed Bahadur Shah to Deccan to fight for him.
In Zafarnama, Guru Gobind Singh states that the reason he was in conflict with the Hill Rajas was that while they were worshiping idols, while he was an idol-breaker.
And idiot Hindus place him along Maharana, Prithviraj and Shivaji as saviours of Dharma.


You May Also Like

1/Politics thread time.
To me, the most important aspect of the 2018 midterms wasn't even about partisan control, but about democracy and voting rights. That's the real battle.
2/The good news: It's now an issue that everyone's talking about, and that everyone cares about.
3/More good news: Florida's proposition to give felons voting rights won. But it didn't just win - it won with substantial support from Republican voters.
That suggests there is still SOME grassroots support for democracy that transcends
4/Yet more good news: Michigan made it easier to vote. Again, by plebiscite, showing broad support for voting rights as an
5/OK, now the bad news.
We seem to have accepted electoral dysfunction in Florida as a permanent thing. The 2000 election has never really
Bad ballot design led to a lot of undervotes for Bill Nelson in Broward Co., possibly even enough to cost him his Senate seat. They do appear to be real undervotes, though, instead of tabulation errors. He doesn't really seem to have a path to victory. https://t.co/utUhY2KTaR
— Nate Silver (@NateSilver538) November 16, 2018

THE MEANING, SIGNIFICANCE AND HISTORY OF SWASTIK
The Swastik is a geometrical figure and an ancient religious icon. Swastik has been Sanatan Dharma’s symbol of auspiciousness – mangalya since time immemorial.
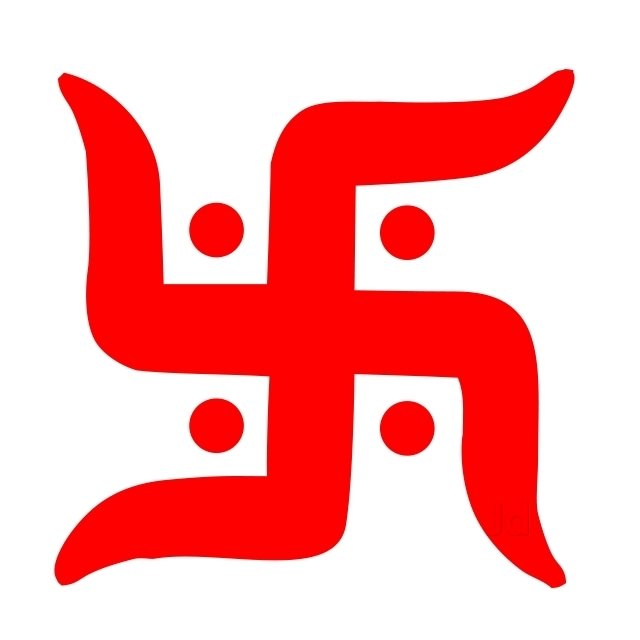
The name swastika comes from Sanskrit (Devanagari: स्वस्तिक, pronounced: swastik) &denotes “conducive to wellbeing or auspicious”.
The word Swastik has a definite etymological origin in Sanskrit. It is derived from the roots su – meaning “well or auspicious” & as meaning “being”.
"सु अस्ति येन तत स्वस्तिकं"
Swastik is de symbol through which everything auspicios occurs
Scholars believe word’s origin in Vedas,known as Swasti mantra;
"🕉स्वस्ति ना इन्द्रो वृधश्रवाहा
स्वस्ति ना पूषा विश्ववेदाहा
स्वस्तिनास्तरक्ष्यो अरिश्तनेमिही
स्वस्तिनो बृहस्पतिर्दधातु"
It translates to," O famed Indra, redeem us. O Pusha, the beholder of all knowledge, redeem us. Redeem us O Garudji, of limitless speed and O Bruhaspati, redeem us".
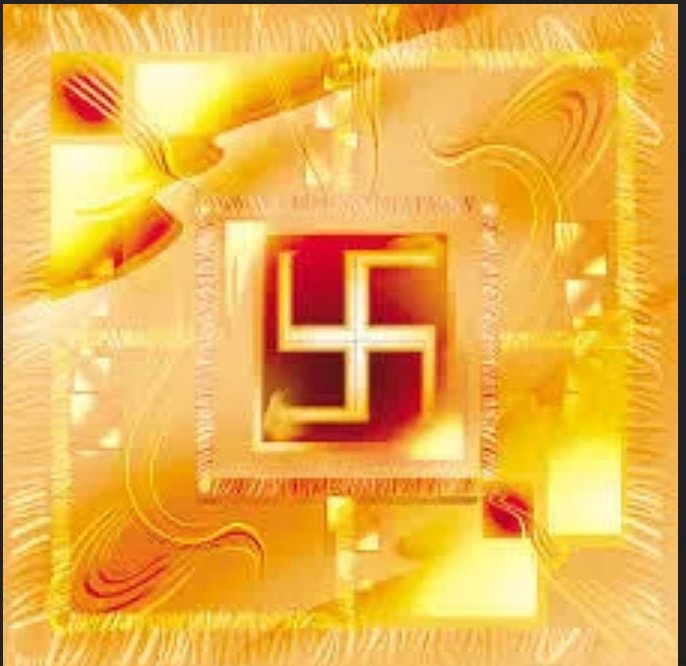
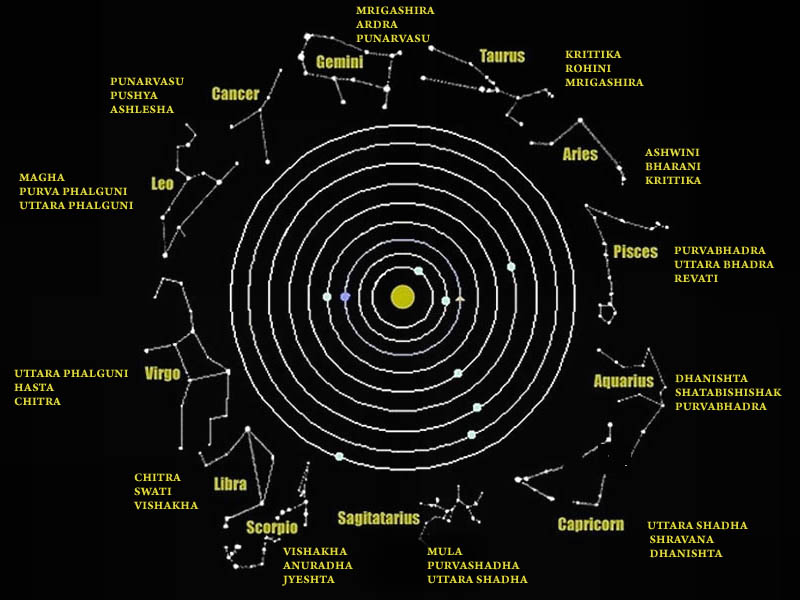
SWASTIK’s COSMIC ORIGIN
The Swastika represents the living creation in the whole Cosmos.

Hindu astronomers divide the ecliptic circle of cosmos in 27 divisions called https://t.co/sLeuV1R2eQ this manner a cross forms in 4 directions in the celestial sky. At centre of this cross is Dhruva(Polestar). In a line from Dhruva, the stars known as Saptarishi can be observed.
The Swastik is a geometrical figure and an ancient religious icon. Swastik has been Sanatan Dharma’s symbol of auspiciousness – mangalya since time immemorial.
The name swastika comes from Sanskrit (Devanagari: स्वस्तिक, pronounced: swastik) &denotes “conducive to wellbeing or auspicious”.
The word Swastik has a definite etymological origin in Sanskrit. It is derived from the roots su – meaning “well or auspicious” & as meaning “being”.
"सु अस्ति येन तत स्वस्तिकं"
Swastik is de symbol through which everything auspicios occurs
Scholars believe word’s origin in Vedas,known as Swasti mantra;
"🕉स्वस्ति ना इन्द्रो वृधश्रवाहा
स्वस्ति ना पूषा विश्ववेदाहा
स्वस्तिनास्तरक्ष्यो अरिश्तनेमिही
स्वस्तिनो बृहस्पतिर्दधातु"
It translates to," O famed Indra, redeem us. O Pusha, the beholder of all knowledge, redeem us. Redeem us O Garudji, of limitless speed and O Bruhaspati, redeem us".
SWASTIK’s COSMIC ORIGIN
The Swastika represents the living creation in the whole Cosmos.
Hindu astronomers divide the ecliptic circle of cosmos in 27 divisions called https://t.co/sLeuV1R2eQ this manner a cross forms in 4 directions in the celestial sky. At centre of this cross is Dhruva(Polestar). In a line from Dhruva, the stars known as Saptarishi can be observed.
Krugman is, of course, right about this. BUT, note that universities can do a lot to revitalize declining and rural regions.
See this thing that @lymanstoneky wrote:
And see this thing that I wrote:
And see this book that @JamesFallows wrote:
And see this other thing that I wrote:
One thing I've been noticing about responses to today's column is that many people still don't get how strong the forces behind regional divergence are, and how hard to reverse 1/ https://t.co/Ft2aH1NcQt
— Paul Krugman (@paulkrugman) November 20, 2018
See this thing that @lymanstoneky wrote:
And see this thing that I wrote:
And see this book that @JamesFallows wrote:
And see this other thing that I wrote:


