1. Heikin-Ashi, also called Heiken-Ashi, is translated as an "average bar" in Japanese.
2. The Heikin Ashi strategy is a useful tool used in identifying market trends and
predicting the future prices of assets.
2/N


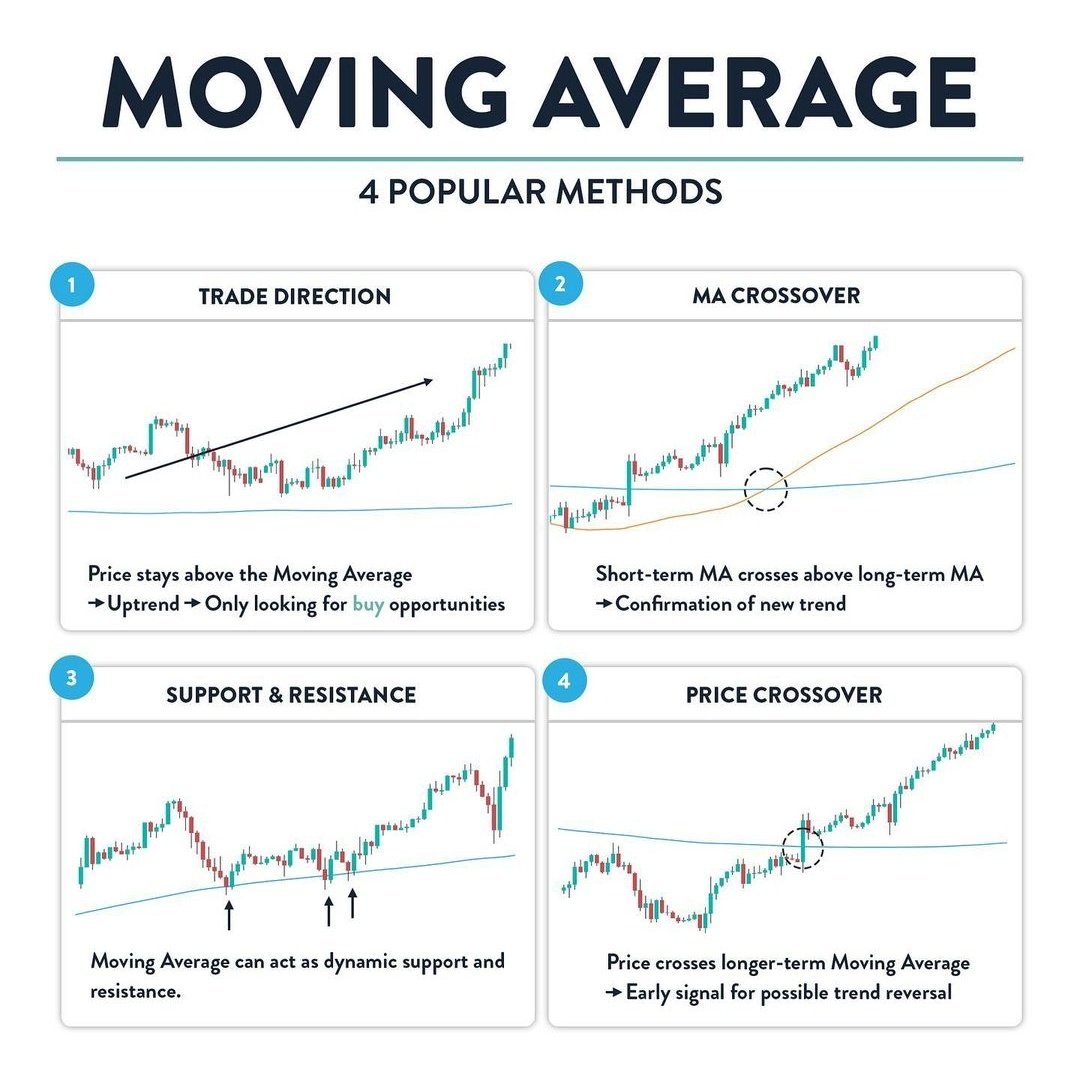
ULTIMATE GUIDE TO 21 and 200 Moving Average
— JayneshKasliwal (@JayneshKasliwal) November 14, 2021
SUNDAY THREAD \U0001f516
A trend Following System That will Help You Improve Trading immensely.
RETWEET AND SHARE \U0001f504@kuttrapali26 @AmitabhJha3 #stocks #StockMarket
1/n
The stock exploded & went up as much as 63% from my price.
— Manas Arora (@iManasArora) June 22, 2020
Closed my position entirely today!#BroTip pic.twitter.com/CRbQh3kvMM
What an extended (away from averages) move looks like!!
— Manas Arora (@iManasArora) June 24, 2020
If you don't learn to sell into strength, be ready to give away the majority of your gains.#GLENMARK pic.twitter.com/5DsRTUaGO2
#HIKAL
— Manas Arora (@iManasArora) July 2, 2021
Closed remaining at 560
Reason: It is 40+% from 10wma. Super extended
Total revenue: 11R * 0.25 (size) = 2.75% on portfolio
Trade closed pic.twitter.com/YDDvhz8swT
When you see 15 green weeks in a row, that's the end of the move. *Extended*
— Manas Arora (@iManasArora) August 26, 2019
Simple price action analysis.#Seamecltd https://t.co/gR9xzgeb9K