
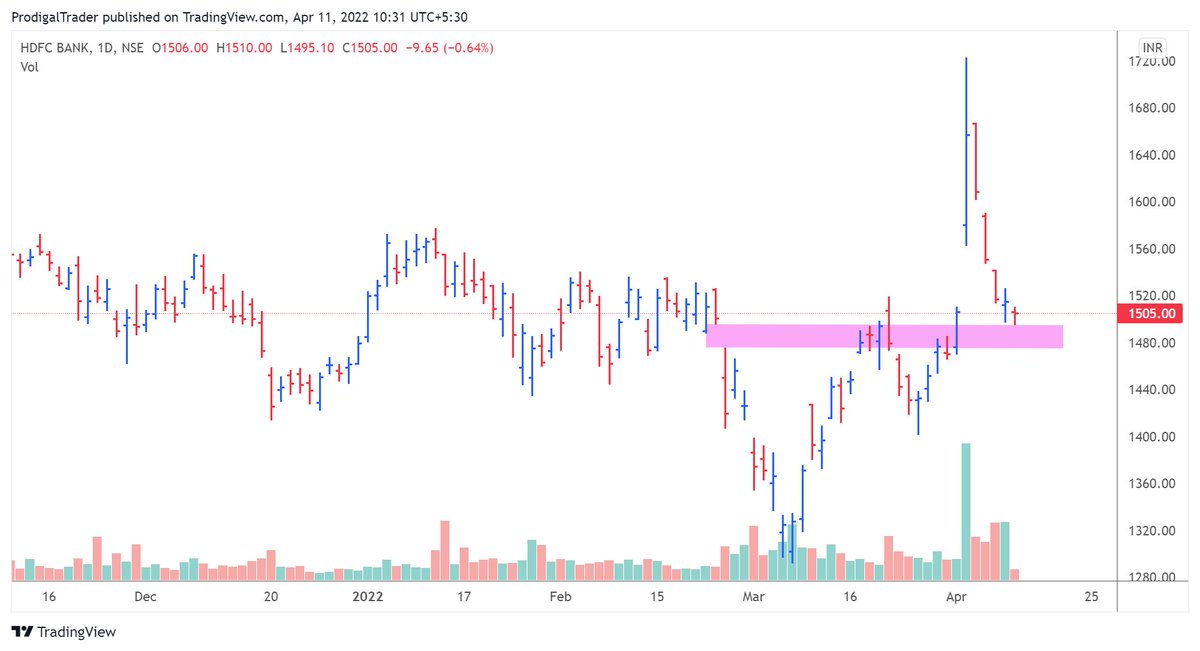
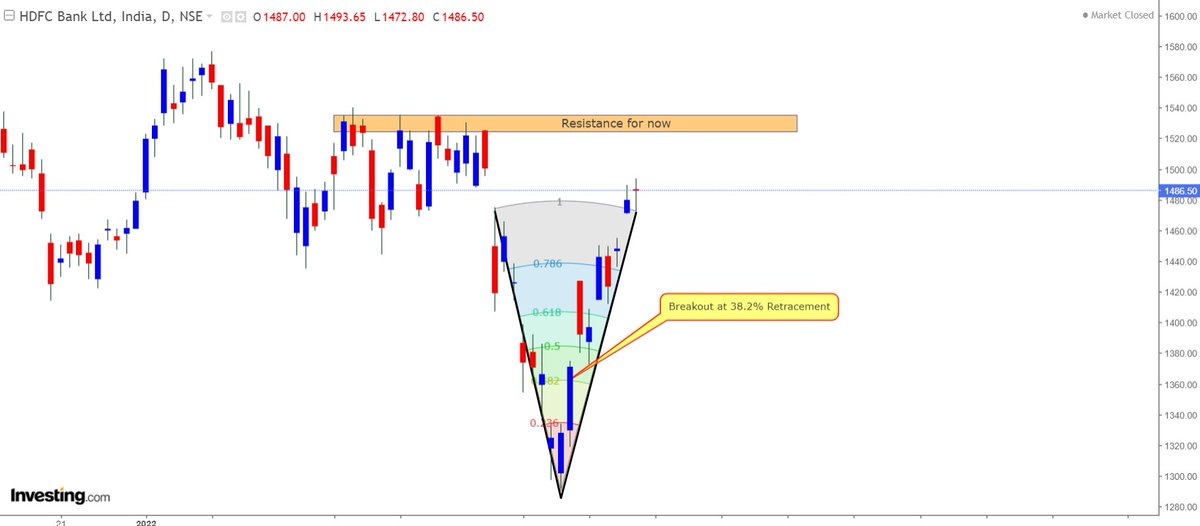
#HDFCBANK -1469
Current structure on weekly chart.
If weekly closing above blue dotted line than may try for new ATH.
Base Case (1425-1459)
#Probability

More from MaRkET WaVES (DINESH PATEL ) Stock Market FARMER


More from Hdfcbank


You May Also Like


Joshua Hawley, Missouri's Junior Senator, is an autocrat in waiting.
His arrogance and ambition prohibit any allegiance to morality or character.
Thus far, his plan to seize the presidency has fallen into place.
An explanation in photographs.
🧵
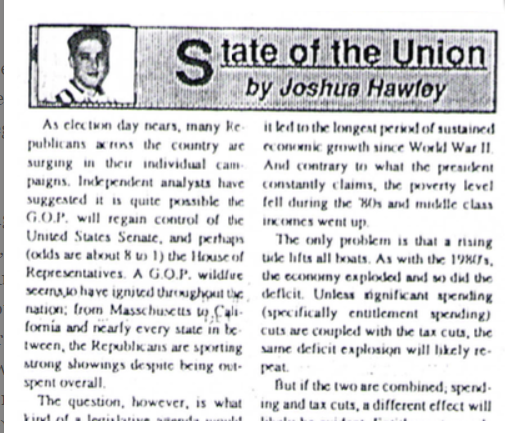
Joshua grew up in the next town over from mine, in Lexington, Missouri. A a teenager he wrote a column for the local paper, where he perfected his political condescension.
2/
By the time he reached high-school, however, he attended an elite private high-school 60 miles away in Kansas City.
This is a piece of his history he works to erase as he builds up his counterfeit image as a rural farm boy from a small town who grew up farming.
3/

After graduating from Rockhurst High School, he attended Stanford University where he wrote for the Stanford Review--a libertarian publication founded by Peter Thiel..
4/
(Full Link: https://t.co/zixs1HazLk)

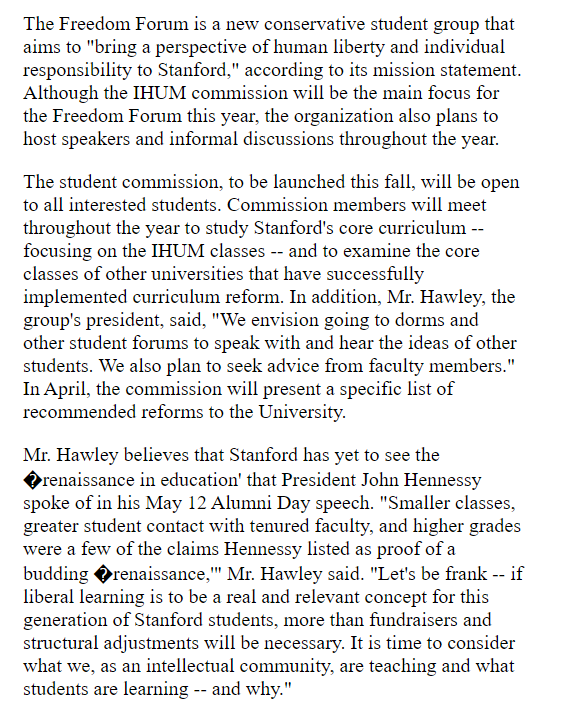
Hawley's writing during his early 20s reveals that he wished for the curriculum at Stanford and other "liberal institutions" to change and to incorporate more conservative moral values.
This led him to create the "Freedom Forum."
5/
His arrogance and ambition prohibit any allegiance to morality or character.
Thus far, his plan to seize the presidency has fallen into place.
An explanation in photographs.
🧵
Joshua grew up in the next town over from mine, in Lexington, Missouri. A a teenager he wrote a column for the local paper, where he perfected his political condescension.
2/
By the time he reached high-school, however, he attended an elite private high-school 60 miles away in Kansas City.
This is a piece of his history he works to erase as he builds up his counterfeit image as a rural farm boy from a small town who grew up farming.
3/
After graduating from Rockhurst High School, he attended Stanford University where he wrote for the Stanford Review--a libertarian publication founded by Peter Thiel..
4/
(Full Link: https://t.co/zixs1HazLk)
Hawley's writing during his early 20s reveals that he wished for the curriculum at Stanford and other "liberal institutions" to change and to incorporate more conservative moral values.
This led him to create the "Freedom Forum."
5/


