Sorry Joe, we realize your Chinese media puppets won’t speak the truth but, that doesn’t mean the truth won’t be spoken...
You are on the wrong side of history...

More from Werise
I like Stephen but I'll bite...
I saw a question asking what data and I answered him. I would gladly share the data & methodology. But I guess I am one of those lowly anons...
I saw a question asking what data and I answered him. I would gladly share the data & methodology. But I guess I am one of those lowly anons...
before accepting calculations from anonymous (or even non-anymous) sources, insist on a citation to original data so that it can be checked. I'm told (but haven't seen reference by Werise) that this comes from NYT json data https://t.co/6SD5ENF137. I'll comment on this data. pic.twitter.com/nqphPoqTa6
— Stephen McIntyre (@ClimateAudit) November 26, 2020
More from Government
The Manatee-Sarasota area has many connections to the horrific scene of insurrection in Washington DC yesterday. Want to see? Buckle up for this thread: /1
The Manatee GOP expressed support for Josh Hawley’s objections to certification of the electoral college vote. /2

Josh Hawley’s home-state newspaper says Hawley has blood on his hands for a “Capitol coup attempt.” This is who the Manatee GOP cheered on.
Florida GOP Vice Chair & Sarasota County Commissioner Christian Ziegler was at the protest, as described in this @HeraldTribune article.
The protest was led by the same people connected to Ziegler who were filming outside the Vern Buchanan town hall at the Van Wezel in Sarasota in 2017, namely Dustin Stockton. Stockton was also part of Steve Bannon's border wall group. /5
https://t.co/NbOxVqbtO4

The Manatee GOP expressed support for Josh Hawley’s objections to certification of the electoral college vote. /2

Josh Hawley’s home-state newspaper says Hawley has blood on his hands for a “Capitol coup attempt.” This is who the Manatee GOP cheered on.
Florida GOP Vice Chair & Sarasota County Commissioner Christian Ziegler was at the protest, as described in this @HeraldTribune article.
The protest was led by the same people connected to Ziegler who were filming outside the Vern Buchanan town hall at the Van Wezel in Sarasota in 2017, namely Dustin Stockton. Stockton was also part of Steve Bannon's border wall group. /5
https://t.co/NbOxVqbtO4

WOW, Mike Gapes and Joan Ryan are non-Labour JLM conference attendees discussing disciplinary processes with Keir Starmer and Angela Rayner but not a privilege afforded to the people who pay the wages of the party machine. #LabourLeaks #StarmerOut #LFI https://t.co/XZDKR5FmXC

So what should Peter Mandelson talk about at the recent Jewish Labour Movement conference – his worries that an independent process will hamper the party leader Keir Starmer?. #LabourLeaks #StarmerOut #LFI

Mandelson “was there in the 1980s and understands where the power bases of the right are, and how it should be exercised”. Who needs independent processes or oversight when you are in the driving seat?. #LabourLeaks #StarmerOut #LFI
Poale Zion trades as Jewish Labour Movement is a part of the Zionist Federation of the UK and organise within the World Zionist Organisation. You do NOT have to be Jewish or a member of the Labour Party to join. JLM contains CIA asset Ruth Smeeth. #LabourLeaks #StarmerOut #BICOM

Ruth Smeeth, one of the 60 plus anti-Corbyn resignations from the shadow cabinet, formerly held a post with the lobby group, Trevor Chinn's Britain Israel Communications and Research Centre (BICOM). #StarmerOut #BICOM #JLM https://t.co/H2a9vnsnRP


So what should Peter Mandelson talk about at the recent Jewish Labour Movement conference – his worries that an independent process will hamper the party leader Keir Starmer?. #LabourLeaks #StarmerOut #LFI

Mandelson “was there in the 1980s and understands where the power bases of the right are, and how it should be exercised”. Who needs independent processes or oversight when you are in the driving seat?. #LabourLeaks #StarmerOut #LFI
Poale Zion trades as Jewish Labour Movement is a part of the Zionist Federation of the UK and organise within the World Zionist Organisation. You do NOT have to be Jewish or a member of the Labour Party to join. JLM contains CIA asset Ruth Smeeth. #LabourLeaks #StarmerOut #BICOM

Ruth Smeeth, one of the 60 plus anti-Corbyn resignations from the shadow cabinet, formerly held a post with the lobby group, Trevor Chinn's Britain Israel Communications and Research Centre (BICOM). #StarmerOut #BICOM #JLM https://t.co/H2a9vnsnRP

Which metric is a better predictor of the severity of the fall surge in US states?
1) Margin of Democrat victory in Nov 2020 election
or
2) % infected through Sep 1, 2020
Can you guess which plot is which?

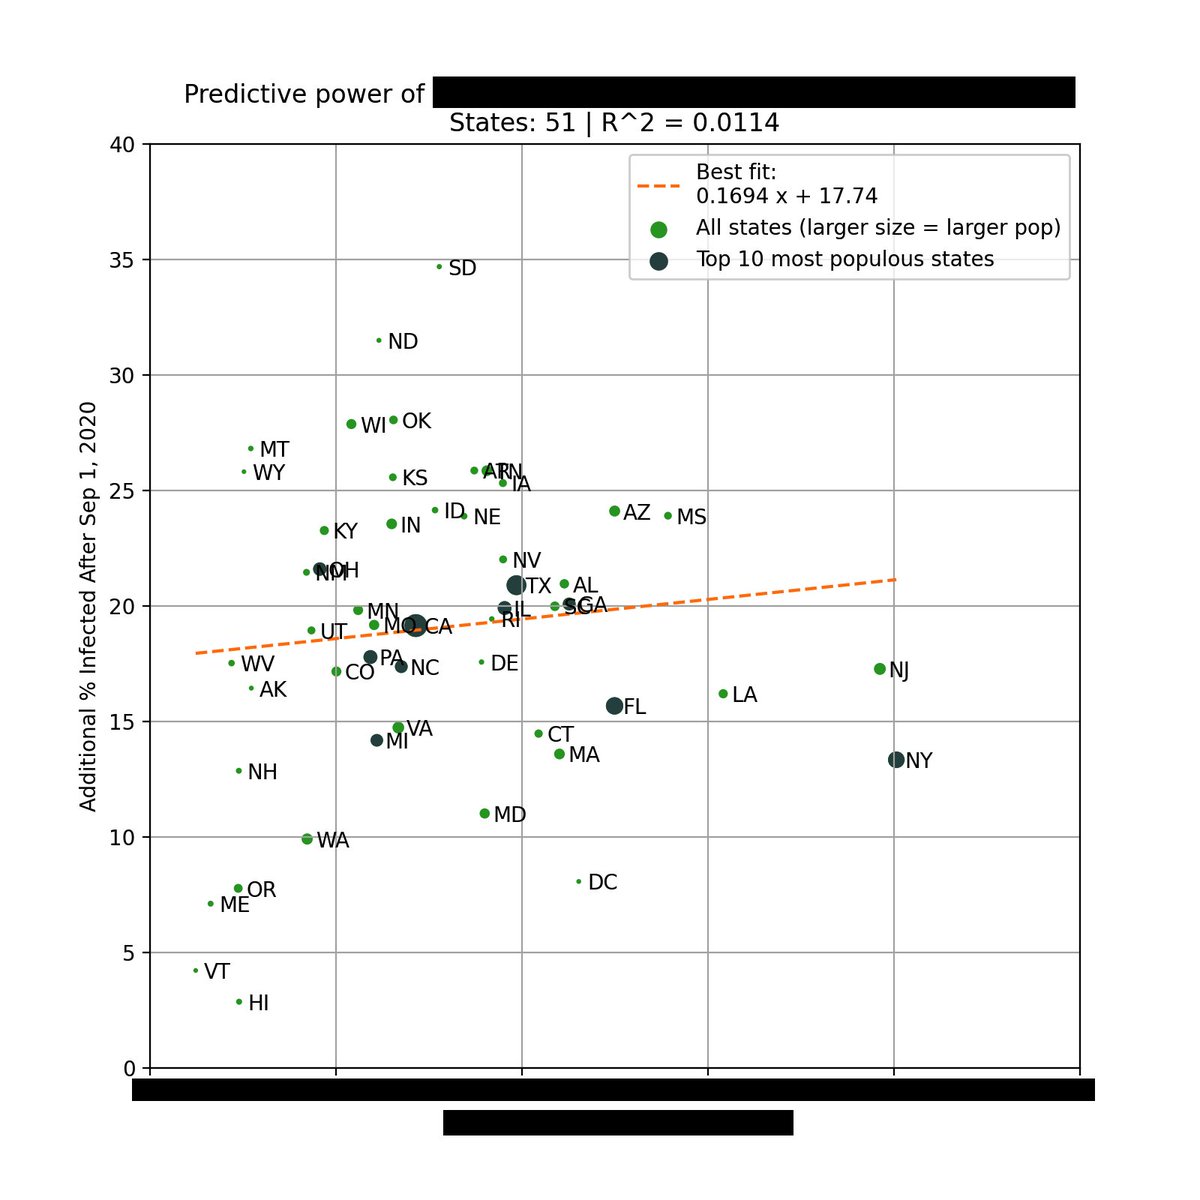
The left plot is based on the % infected through Sep 1, 2020. You can see that there is very little correlation with the % infected since Sep 1.
However, there is a *strong* correlation when using the margin of Biden's victory (right).
Infections % from https://t.co/WcXlfxv3Ah.

This is the strongest single variable I've seen in being able to explain the severity of this most recent wave in each state.
Not past infections / existing immunity, population density, racial makeup, latitude / weather / humidity, etc.
But political lean.
One can argue that states that lean Democrat are more likely to implement restrictions/mandates.
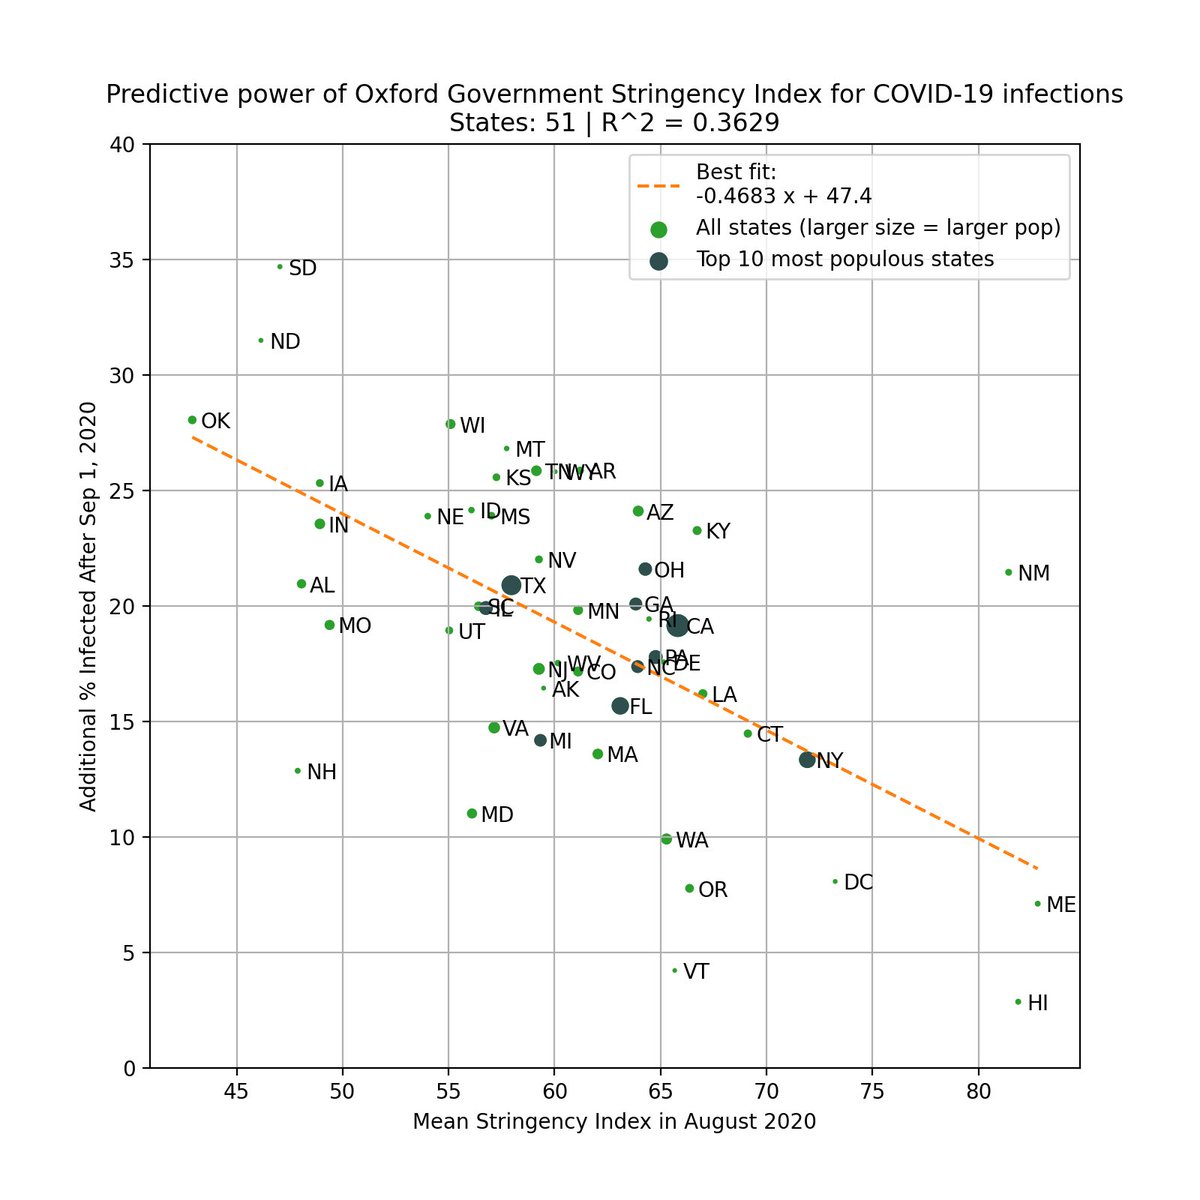
This is valid, so we test this by using the Government Stringency Index made by @UniofOxford.
We also see a correlation, but it's weaker (R^2=0.36 vs 0.50).
https://t.co/BxBBKwW6ta

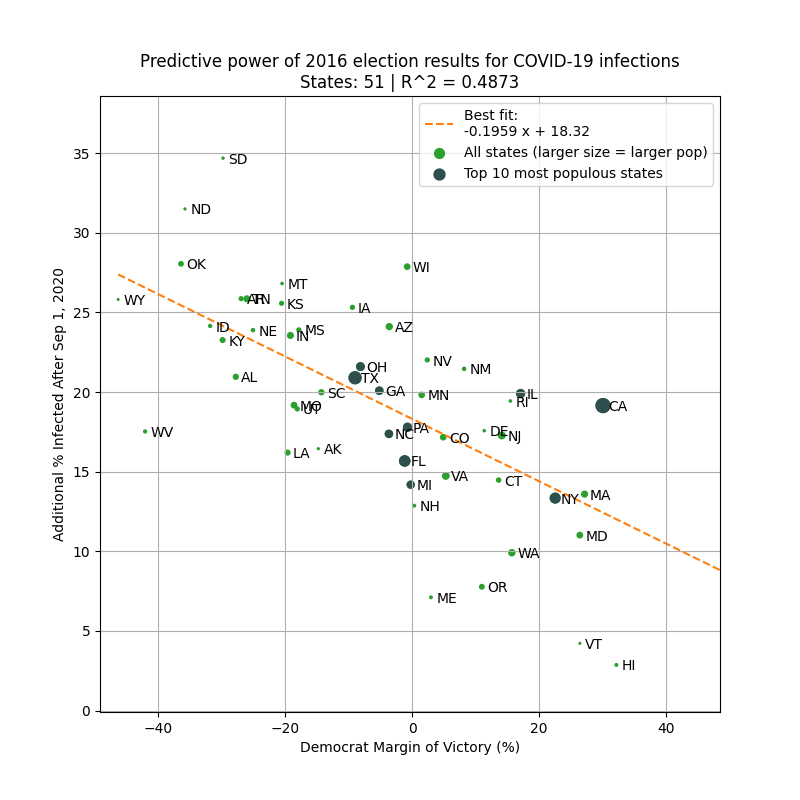
To avoid look-ahead bias/confounding variables, here is the same analysis but using 2016 margin of victory as the predictor. Similar results.
This basically says that 2016 election results is a better predictor of the severity of the fall wave than intervention levels in 2020!

1) Margin of Democrat victory in Nov 2020 election
or
2) % infected through Sep 1, 2020
Can you guess which plot is which?

The left plot is based on the % infected through Sep 1, 2020. You can see that there is very little correlation with the % infected since Sep 1.
However, there is a *strong* correlation when using the margin of Biden's victory (right).
Infections % from https://t.co/WcXlfxv3Ah.

This is the strongest single variable I've seen in being able to explain the severity of this most recent wave in each state.
Not past infections / existing immunity, population density, racial makeup, latitude / weather / humidity, etc.
But political lean.
One can argue that states that lean Democrat are more likely to implement restrictions/mandates.
This is valid, so we test this by using the Government Stringency Index made by @UniofOxford.
We also see a correlation, but it's weaker (R^2=0.36 vs 0.50).
https://t.co/BxBBKwW6ta

To avoid look-ahead bias/confounding variables, here is the same analysis but using 2016 margin of victory as the predictor. Similar results.
This basically says that 2016 election results is a better predictor of the severity of the fall wave than intervention levels in 2020!


