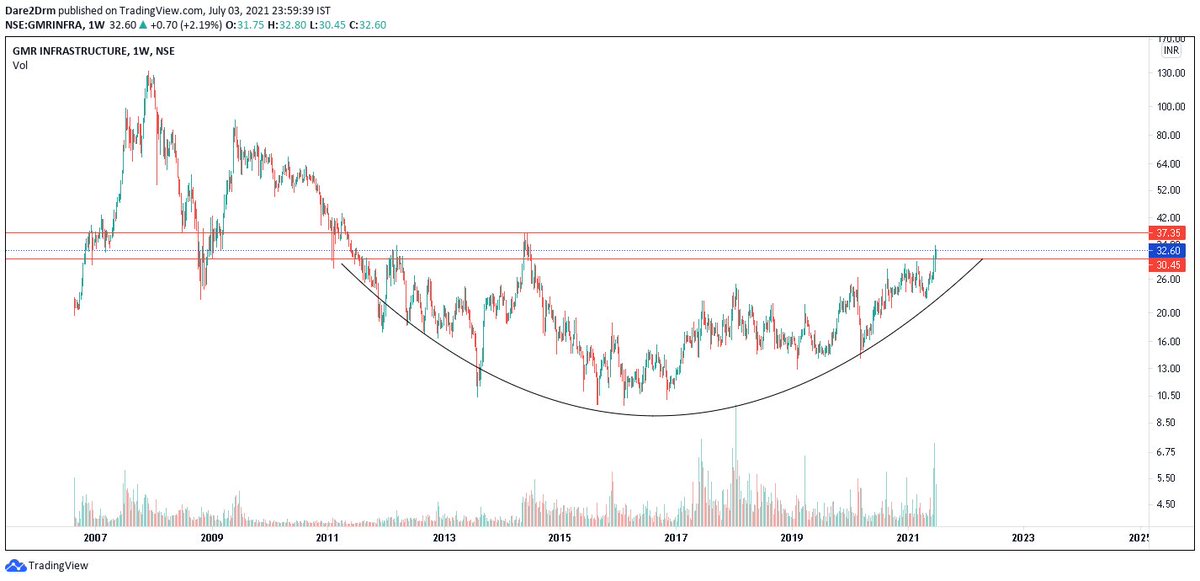
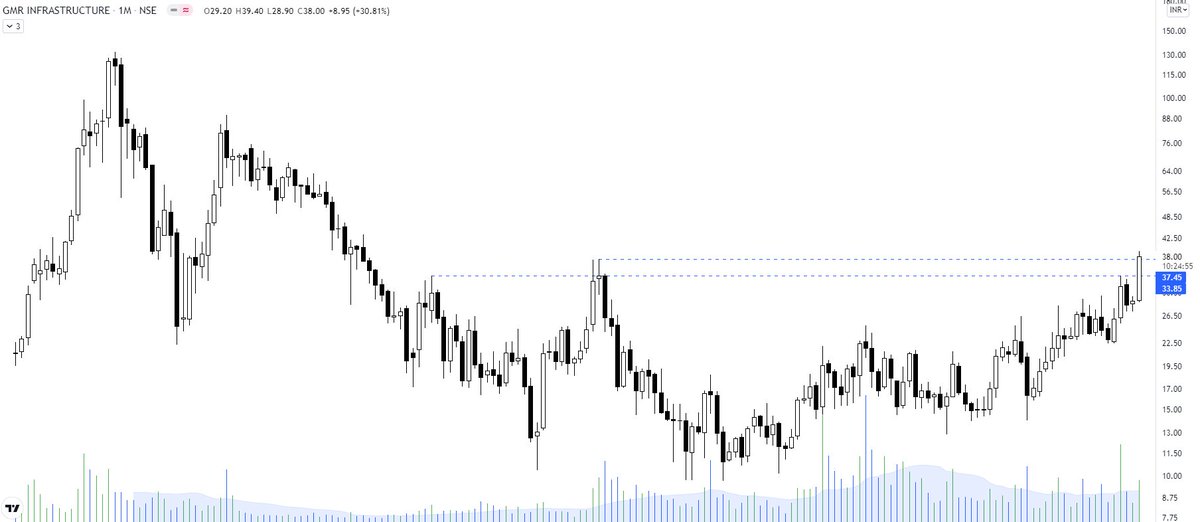
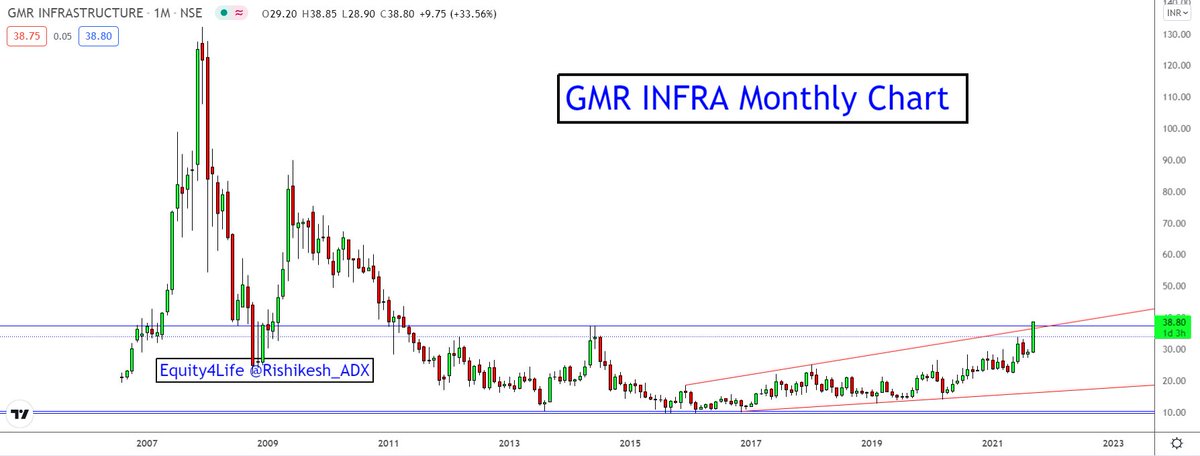
GMR Infra - A monthly close above 38 will confirm the breakout above 2012 highs. The primary aim would be to ride the trend till it reverses. Will wait for the closing today. ✅
More from The_Chartist 📈

IEX Indian Energy Exchange - ⭕️⭕️
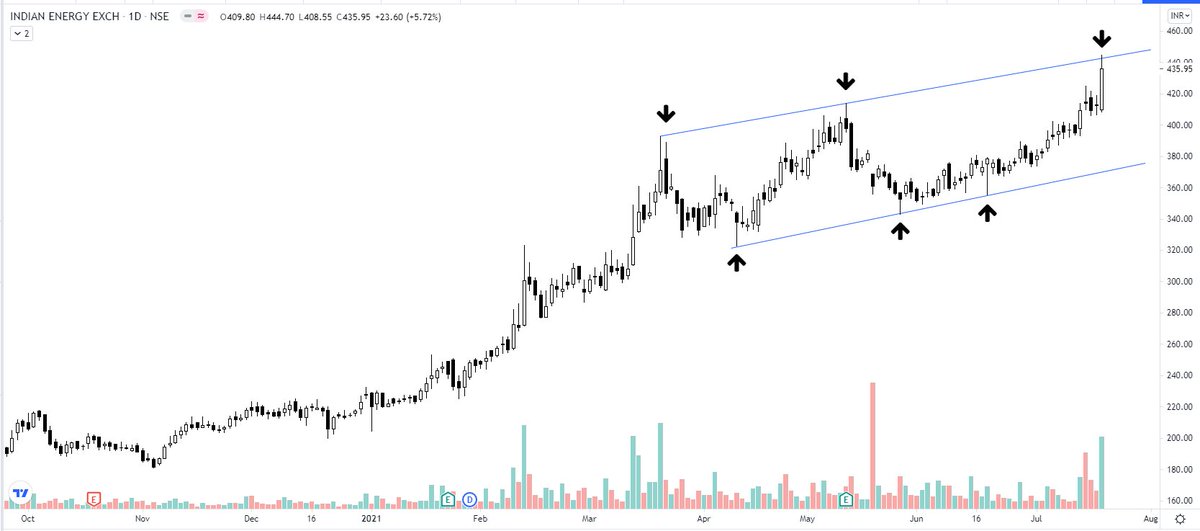
although a must-have portfolio stock. Faced resistance right at the upper channel boundary. Volumes high. Any retracement back to the lower boundary will be an opportunity to accumulate. https://t.co/5uDsUXsbPP
although a must-have portfolio stock. Faced resistance right at the upper channel boundary. Volumes high. Any retracement back to the lower boundary will be an opportunity to accumulate. https://t.co/5uDsUXsbPP
IEX - the resistance turning support. Kindly review, please. @nishkumar1977 @suru27 @rohanshah619 @indian_stockss @sanstocktrader @BissaGauravB @RajarshitaS @PAVLeader @Rishikesh_ADX @VijayThk @Investor_Mohit @TrendTrader85 pic.twitter.com/7CCzmee5If
— Steve Nison (@nison_steve) December 18, 2020
Mahindra & Mahindra - updated chart
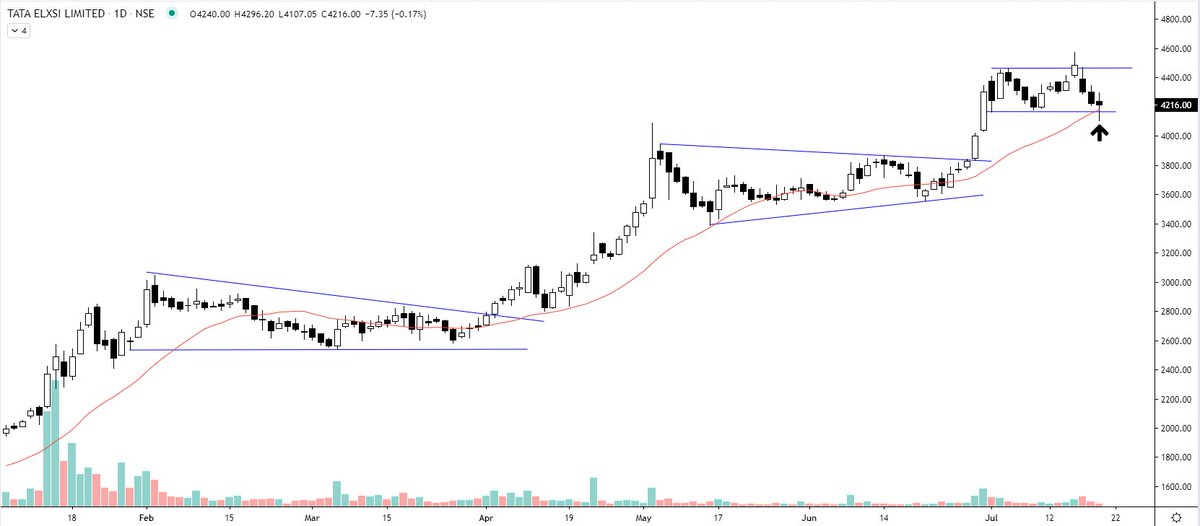
A bullish flag pattern right after the breakout. Although the broader rectangle target of 1190 is way more than this bullish flag target https://t.co/wdAzb7SS7L
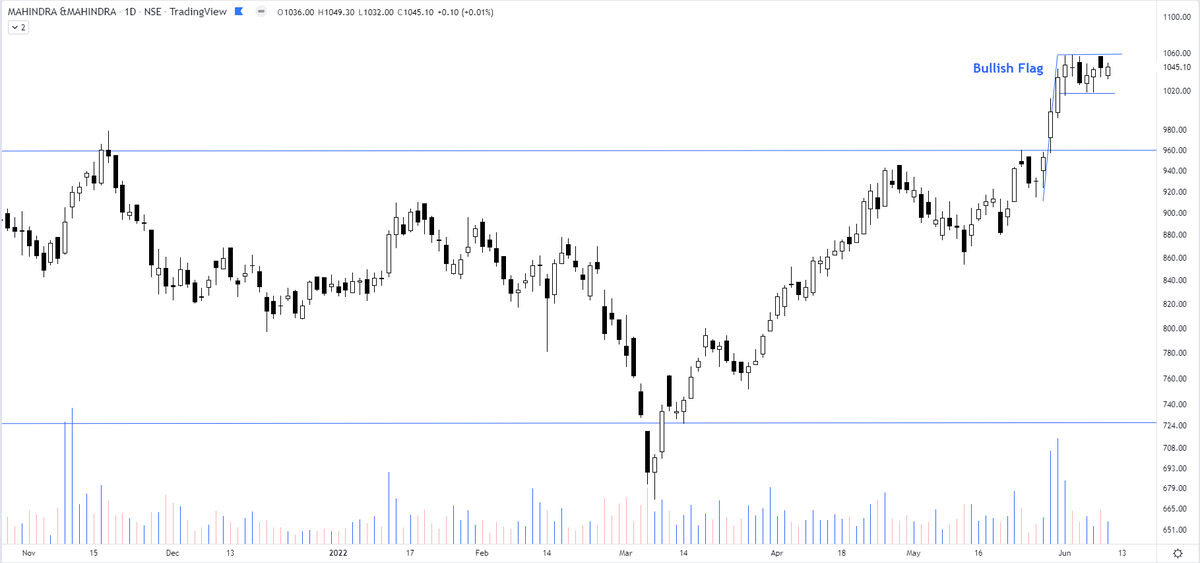
A bullish flag pattern right after the breakout. Although the broader rectangle target of 1190 is way more than this bullish flag target https://t.co/wdAzb7SS7L
Interesting chart of Mahindra & Mahindra consolidating in a rectangle pattern & the price not falling back to the lower support. pic.twitter.com/GJ7rCfkB9f
— The_Chartist \U0001f4c8 (@charts_zone) May 26, 2022
More from Gmrinfra



#GMRINFRA
https://t.co/nY0plirqMe
https://t.co/nY0plirqMe
#GMRINFRA
— @TradeWise\u2122 \u26a1 (@charan_more) September 28, 2020
For the last 8-9 years, we have witnessed sideways trading range GMRINRA between 10-35 with multiple rounding bottom. are we missing the breakout timing of GMRINRA after one decade narrowed trading? pic.twitter.com/j8uxP3g5oT