The paper isn't about utility. It’s about expected value.
Bernoulli used the utility concept to get the reader to abandon the traditional view of expected value(arithmetic average), and then used it to derive the equation for valuing risk.
The final equation doesn’t use utility
He starts out the paper identifying that tradition evaluation of risk come from expected values, which are calculated with the arithmetic average.
Notice the rule here in italics is about expected values.
Then points out that this average ignores anything about the specific financial circumstances of the participant. It’s not a risk aversion point, but that a poor person values money differently than a rich person.
Therefore the rule for determining expected values must not be correct. An item is valued by its usefulness (utility) therefore the expected value must also reflect the usefulness it yields.
This was originally Latin, so not sure of the translation, but I love the word yields.
I also love that Bernoulli noticed a disconnect between using the arithmetic average as the expected value and how the world really works.
Instead of calling people flawed for not following it, he chose to call the theory flawed instead.
The idea of the arithmetic average being expected and the foundation of rational decisions was pretty well entrenched at the time.
So he has to use the concept of utility here to break people of this belief that the arithmetic was expected.
Essentially explaining that people should have different usefulness for the money.
He runs through various examples to convince people that the arithmetic average can’t possibly describe the true risk, outlining some extreme cases to emphasize the flaw in the arithmetic average.
After he does that though, he returns to normal and say, most of these examples were unusual. We should focus instead on what’s typical, which he says is that people find usefulness from money in proportion to their wealth.
As in usefulness = money / wealth.
Then he runs off on a tangent about income, and then returns to the previous point to double down on it, repeating it nearly identically.
Money/wealth is simply growth.
So he’s saying we derive usefulness from growth, not absolute price.
This is his foundational point.
To give you an analogy from today’s world, Imagine Bernoulli surrounded by a everyone quoting Dow moves in points.
This drove him nuts and his response was, “nobody cares about points, you should quote it in percent gain.”
So now that the hypothesis is clear--usefulness comes from growth, not absolute gains--he begins to derive the formula. He starts out with a generic “utility curve”. It’s clearly a logarithm, but thats not stated or derived yet. He’s just dropping logical constraints now.
The x axis is real world wealth. The Y axis is utility. B is the current wealth.
Bernoulli averages this mythical utility. The PO line is this average, from the utility of 4 possible outcomes GC, DH, EL, and FM. This is where EUT starts comparing things
But Bernoulli aims to then to translate P back to real world wealth at O.
He went into utility space did some math, and then left utility, returning to the real world.
Next he calculates the EXPECTED GAIN by subtracting this value O from the original value B.
He says to go into the utility function (which he hasn’t made clear is a logarithm yet), average the results, then leave utility to calculate a new expected value!
Bernoulli, doesn’t care about utility, he’s only using it calculate the correct expected value in our world!
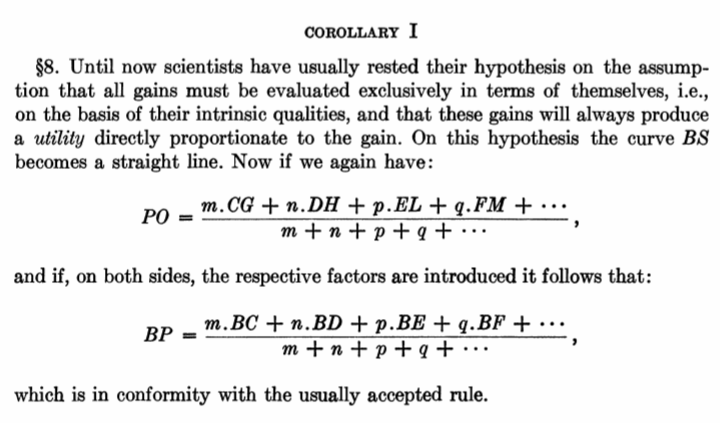
Bernoulli then maps the current world’s beliefs of expectation into his chart method. Remember, he hasn’t yet said it’s a logarithm.
So he shows that in the arithmetic view of expected values, the curve isn’t a curve but a straight line. He still works back to real values(BP).
The paper next returns back the key hypnosis:
Usefulness of gains is inversely proportional to current wealth
and derives the equation for this curve.
This is where he shows his hypothesis leads to a logarithmic utility curve.
He then takes this logarithm curve and goes back to his original chart method of expected value from utility, combines them, and simplifies.
Producing his final equation and ultimate solution for a new expected value.
It is a geometric average.
Its eye opening that Bernoulli’s final equation doesn’t include utility at all. Its been simplified out. Furthermore, the equation is meant to find the value of the risky proposition. It’s supposed to convey the risk’s worth in actual real dollars, not an imaginary utility value.
It’s also eye opening that his ultimate rule compares the geometric return of the potential outcomes to the original wealth.
He has replaced the arithmetic return with the geometric return. The geometric average indicates the value of the risky proposition.
Bernoulli only used utility to convince people they were valuing risk wrong, and then as necessary to derive the final solution.
But utility isn’t part of his solution, it was just a tool to get there.
The solution is the geometric average.
The paper then tackles examples and shows some interesting finding from employing the geometric average to value risk.
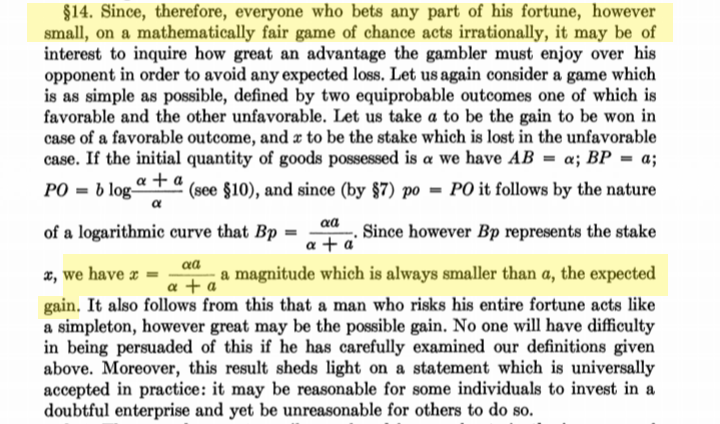
First, he shows that “fair bet” of risk 50 to gain 50 has an expected loss of 13.
Start with 100. Sqrt(50 x 150) = 86.6. 100-86.6 =13.4
I love that he then calls those using the arithmetic return to evaluate fair bets irrational. I wonder if most economists realize one of the foundation documents of their professions says they are the irrational ones, not their subjects that they classify as risk averse.
After the irrationality jab, he solves for the properties of a “fair game” for his new view of the expected gain and loss. It takes a bit or rearranging, but this formula matches the Kelly Criterion discovered 200 years later.
Then he tackles a much more complicated problem of shipping insurance.
His solution is entirely about comparing geometric averages. No utility.
He calls the averages the expectation. This is a “size of the bet calculation”, once again similar to Kelly.
Next he explores the usefulness of diversification, calculating the benefit of diversification with the geometric average, and calling the calculation his expectation.
300 years go Bernoulli proved, and quantified, the diversification benefit.
Finally to the St. Petersburg Paradox. Funny how the key puzzle is last, and could be dropped entirely with no effect.
He of course solves the paradox with the geometric average, and interestingly points out the value of something you own is different than something to purchase
This paper is just spectacular, and so much of it is ignored. Its essential point is:
The geometric average, not the arithmetic average, is the expected value and decisions involving risk should be judged from this value.
So why do economists use utility, when Bernoulli condensed it out of his equation and didn’t use it to solve problems? Why do they measure risk aversion from the arithmetic average?
Why does everyone continue to use the arithmetic average as the expected value?
Will it be 3 more centuries until everyone realizes to expect the geometric average?
Full is paper here.
Bernoulli.pdf (
https://t.co/jgjsFIfOFL)
Read it, and then read economist description of what they think he said. See if you agree Bernoulli prescribed a different solution