Thread: P&F Super Pattern
An effective price pattern defined using properties of P&F charts.
#Superpattern #Pointandfigure #Definedge
https://t.co/2xtLAVPBvm
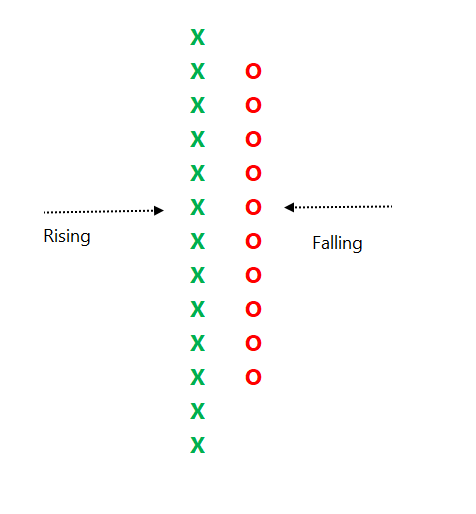
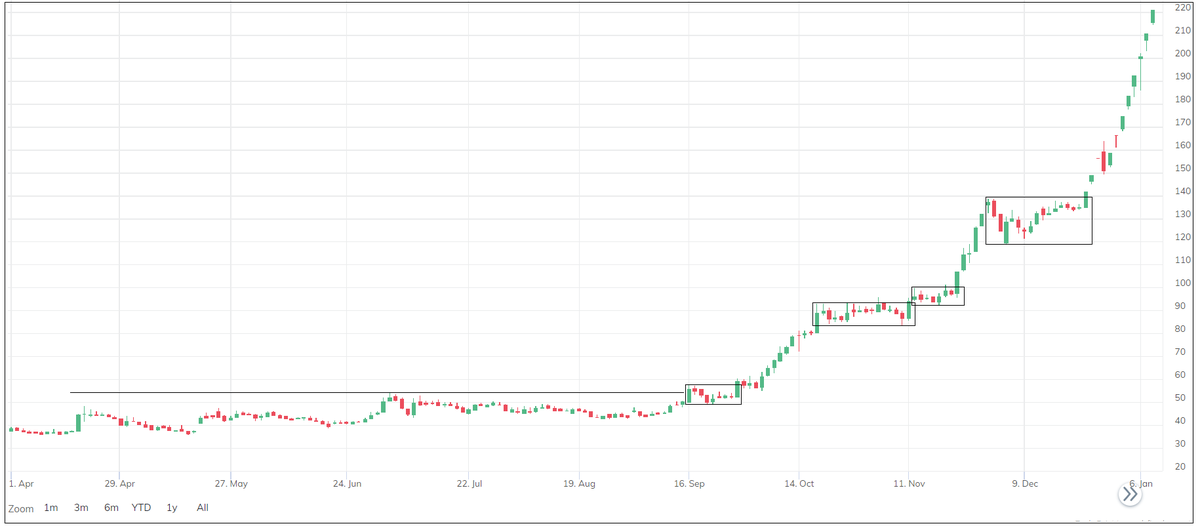
See below chart. Price is in a strong uptrend, P&F chart would produce a long of column of 'X' with more number of boxes in it.
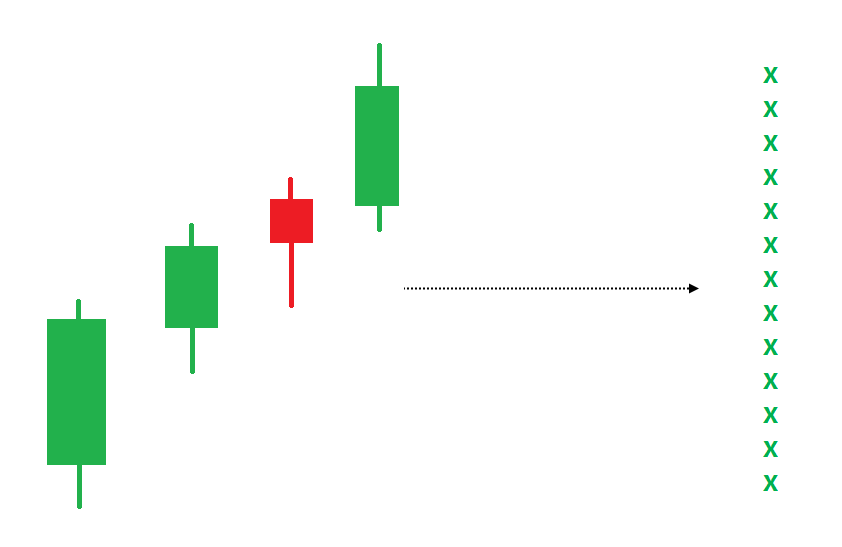
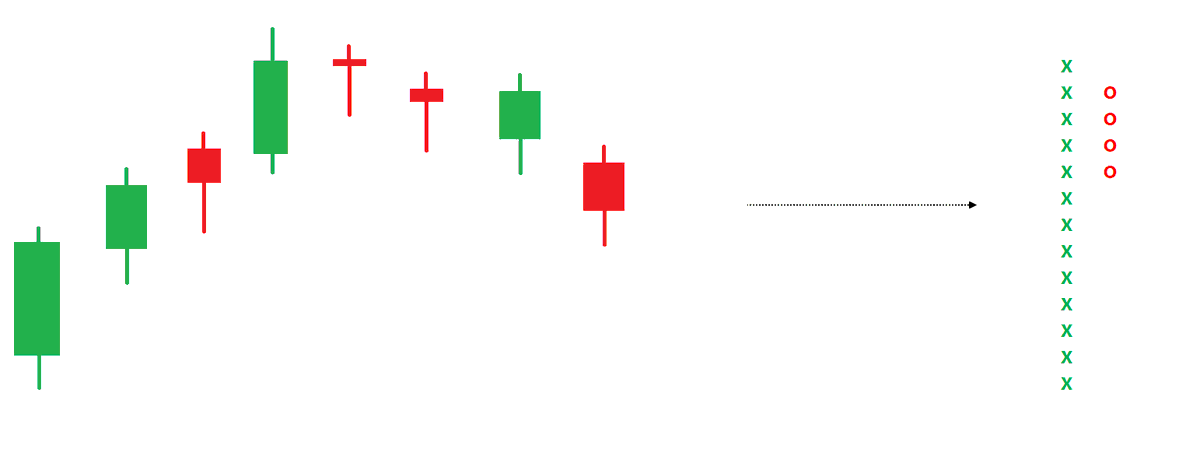
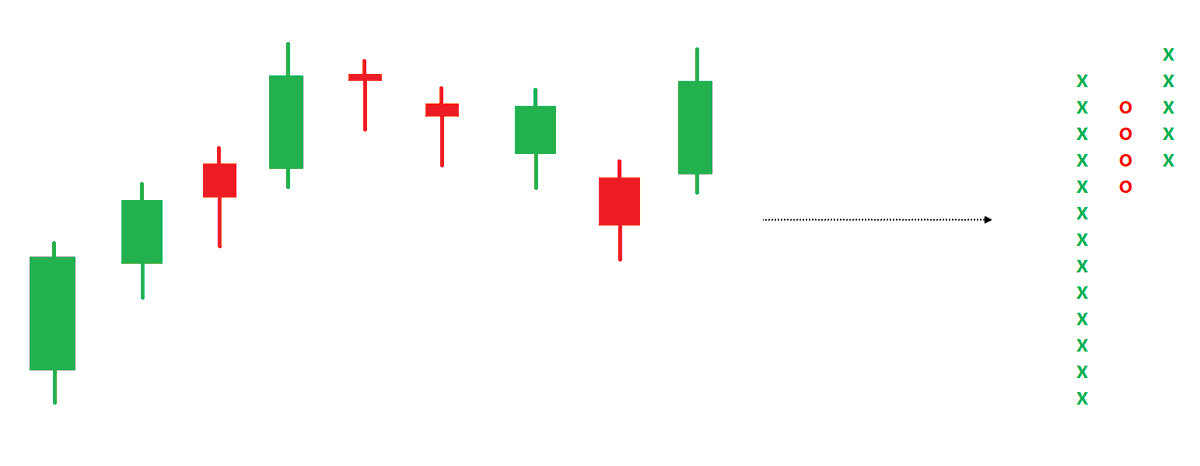
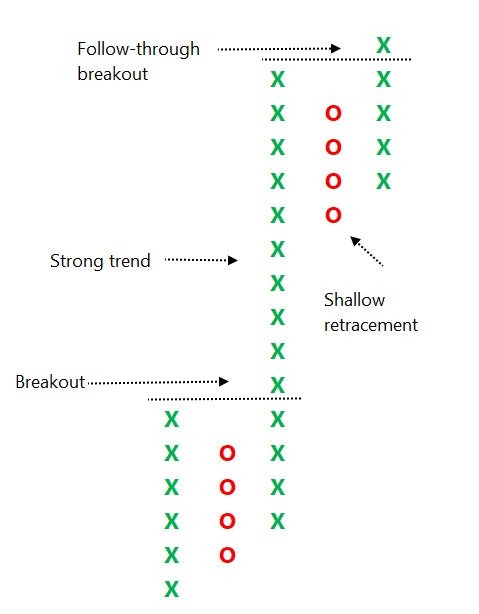
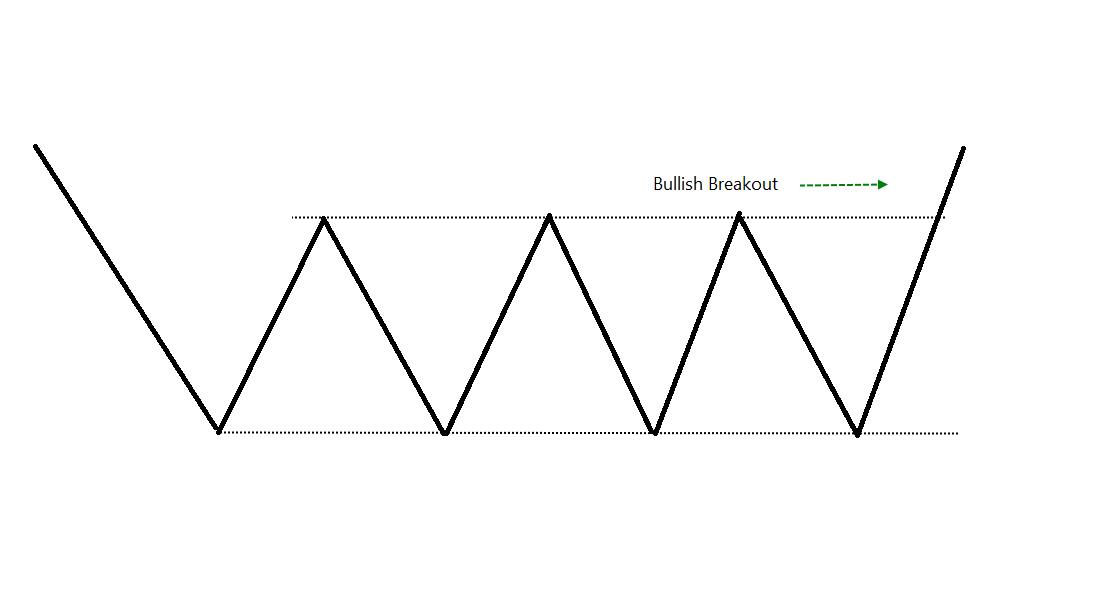
So, the pattern is: Breakout, strong trend, shallow retracement & follow-through price action.
How it is defined clearly and made objective on a P&F chart?
Strong trend= More than 10 boxes of 'X' after breakout
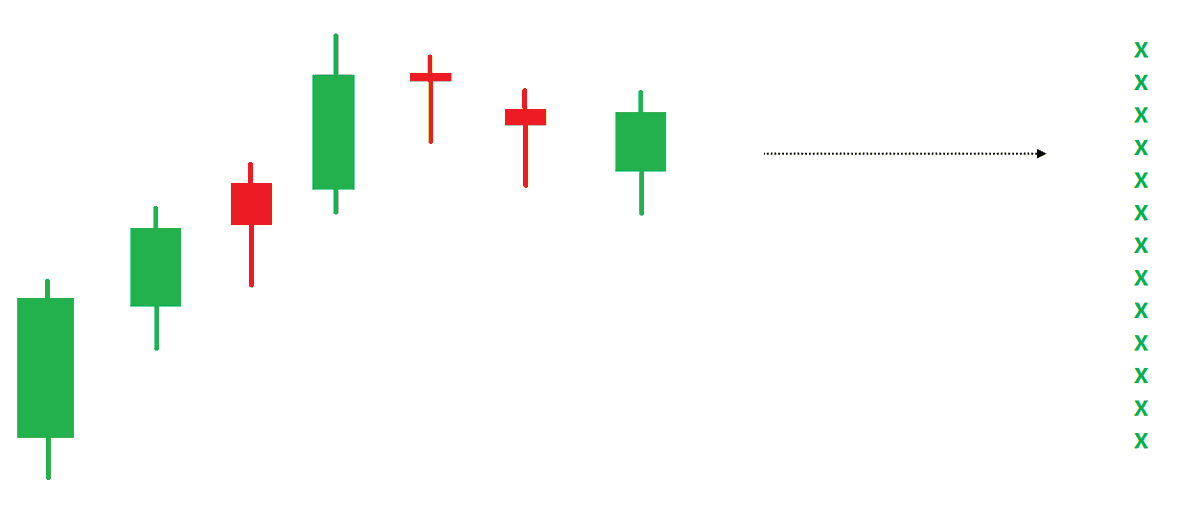
Shallow retracement = Not more than 4 boxes after strong trend
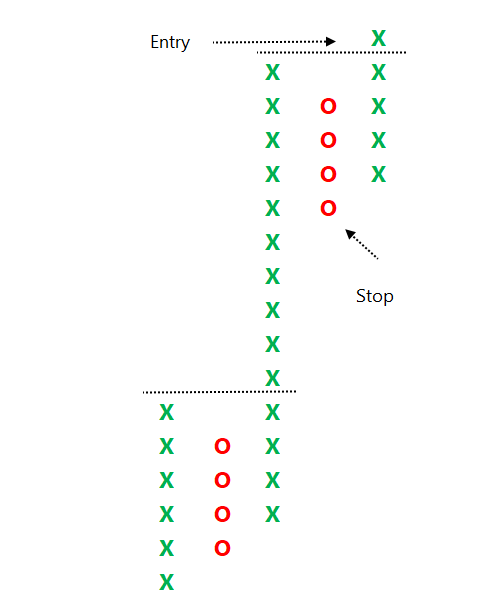
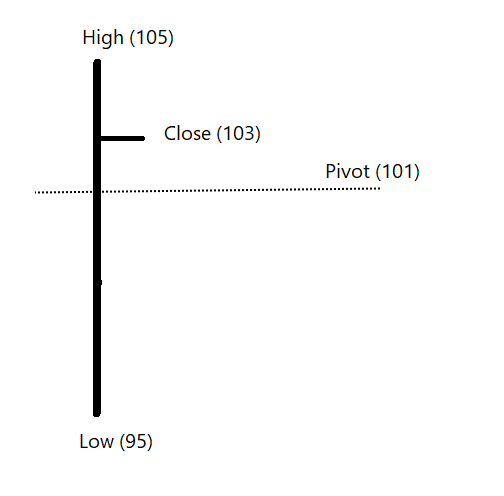
Follow-through = Double-top buy after correction
Initial stop-loss in affordable and risk-reward is high that makes it a tradeable pattern with positive expectancy.
More from Prashant Shah

More from Finance

If you want to become financially independent and don't know where to start, here is a thread that will help you get started
/THREAD/
1. Review your expenses and make a budget
It will help you see where you overspend, make a plan to save, pay down debt and start
2. Set your investing and retirement goals
How much do you need to support yourself in retirement and when do you want to
3. The earlier you start investing, the better.
Here's why and how time and compounding can become your
4. Invest in an index fund
It's easy, safe, cheap, and the best choice for a beginner in investing, with not much time for
/THREAD/
1. Review your expenses and make a budget
It will help you see where you overspend, make a plan to save, pay down debt and start
Budgeting, the 50-30-20 rule, and the envelope method
— Kostas \U0001f468\u200d\U0001f4bc \U0001f4c8 \U0001f4b8 (@itsKostasWithK) January 6, 2021
Your first step towards financial independence
/THREAD/ pic.twitter.com/Tmuc3Itca5
2. Set your investing and retirement goals
How much do you need to support yourself in retirement and when do you want to
The most important number for your retirement: The 4% rule
— Kostas \U0001f468\u200d\U0001f4bc \U0001f4c8 \U0001f4b8 (@itsKostasWithK) January 7, 2021
What Is the Four Percent Rule?
/THREAD/ pic.twitter.com/8n1R1UZI5c
3. The earlier you start investing, the better.
Here's why and how time and compounding can become your
The Miracle of Compound Interest and the Rule of 72
— Kostas \U0001f468\u200d\U0001f4bc \U0001f4c8 \U0001f4b8 (@itsKostasWithK) January 2, 2021
//THREAD// pic.twitter.com/AOqd3kL6cn
4. Invest in an index fund
It's easy, safe, cheap, and the best choice for a beginner in investing, with not much time for
Jack Bogle, the Father of Indexing
— Kostas \U0001f468\u200d\U0001f4bc \U0001f4c8 \U0001f4b8 (@itsKostasWithK) January 8, 2021
How John "Jack" Bogle's creation impacted investors more than Bill Gates, Steve Jobs, and Warren Buffett combined
/THREAD/ pic.twitter.com/4wPi8x3cXn