Bombs were exploding to expose and take down [D]eep State Swamp Creatures that have been fighting with the Scamdemic and Election Fraud, the RV release and NESARA/ GESARA.
MarkZ reported that Paymasters were told to be back to work on Mon. 28 Dec.
More from BK

More from Finance


I'm lucky to attain financial freedom before 30.
I credit Fintwit for my learnings.
Here's 10 key concepts every investor must know:
1. $$ needed to retire
2. Researching a business
3. Reading annual reports
4. Reading earnings calls
5. Criteria of a multi bagger
(Read on...)
6. Holding a multi bagger
7. Economic moats
8. When to buy a stock
9. Earnings vs cashflow
10. Traits of quality companies
Here's my 10 favourite threads on these concepts:
1. How much $$ do you need to retire
Before you start, you must know the end game.
To meet your retirement goals...
How much $$ do you need in your portfolio?
10-K Diver does a good job explaining what's a safe withdrawl rate.
Hint: It's NOT
2. Research a business
Your investment returns are a lagging indicator.
Instead, your research skills are the leading predictor of your results.
Conclusion?
To be a good investor, you must be a great business researcher.
Start with
3. Reading annual reports
This is the bread and butter of a good business analyst.
You cannot just listen to opinions from others.
You must learn to deep dive a business and make your own judgments.
Start with the 10k.
Ming Zhao explains it
I credit Fintwit for my learnings.
Here's 10 key concepts every investor must know:
1. $$ needed to retire
2. Researching a business
3. Reading annual reports
4. Reading earnings calls
5. Criteria of a multi bagger
(Read on...)
6. Holding a multi bagger
7. Economic moats
8. When to buy a stock
9. Earnings vs cashflow
10. Traits of quality companies
Here's my 10 favourite threads on these concepts:
1. How much $$ do you need to retire
Before you start, you must know the end game.
To meet your retirement goals...
How much $$ do you need in your portfolio?
10-K Diver does a good job explaining what's a safe withdrawl rate.
Hint: It's NOT
1/
— 10-K Diver (@10kdiver) July 25, 2020
Get a cup of coffee.
In this thread, I'll help you work out how much money you need to retire.
2. Research a business
Your investment returns are a lagging indicator.
Instead, your research skills are the leading predictor of your results.
Conclusion?
To be a good investor, you must be a great business researcher.
Start with
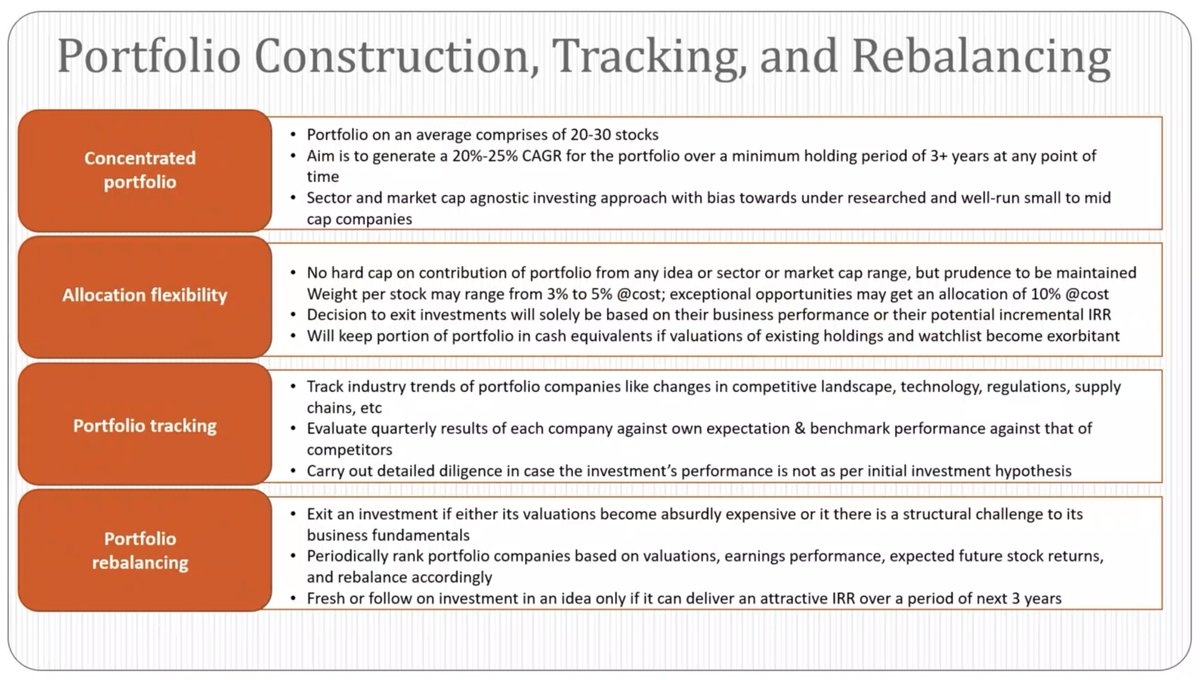
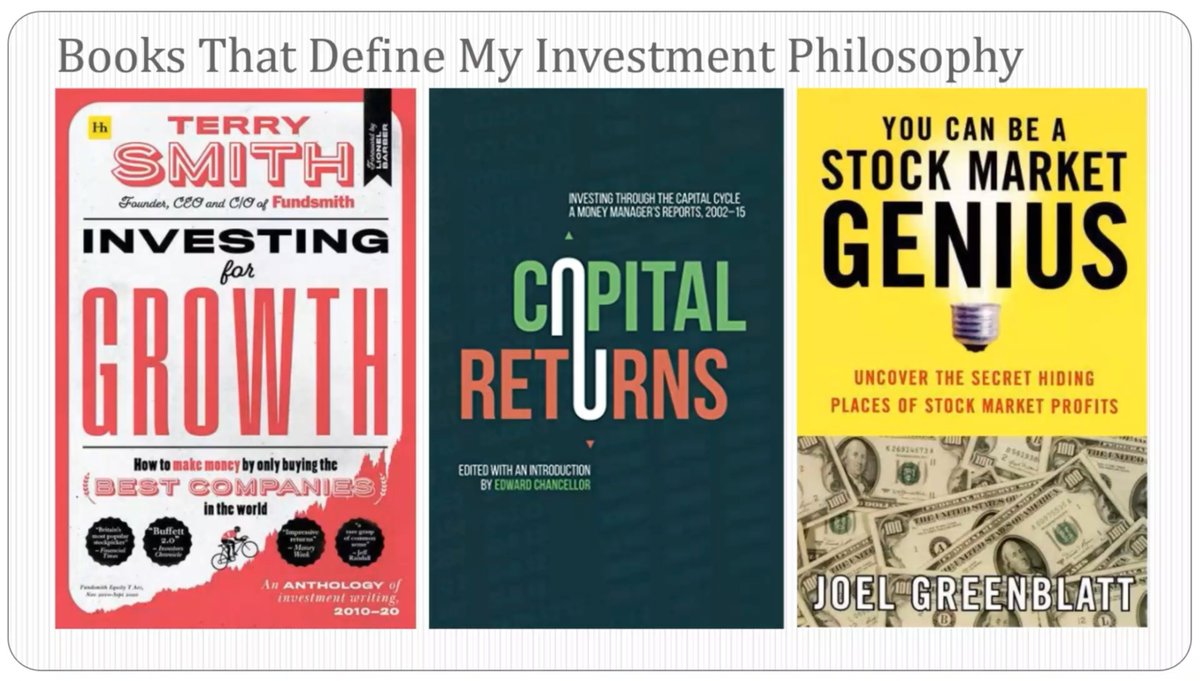
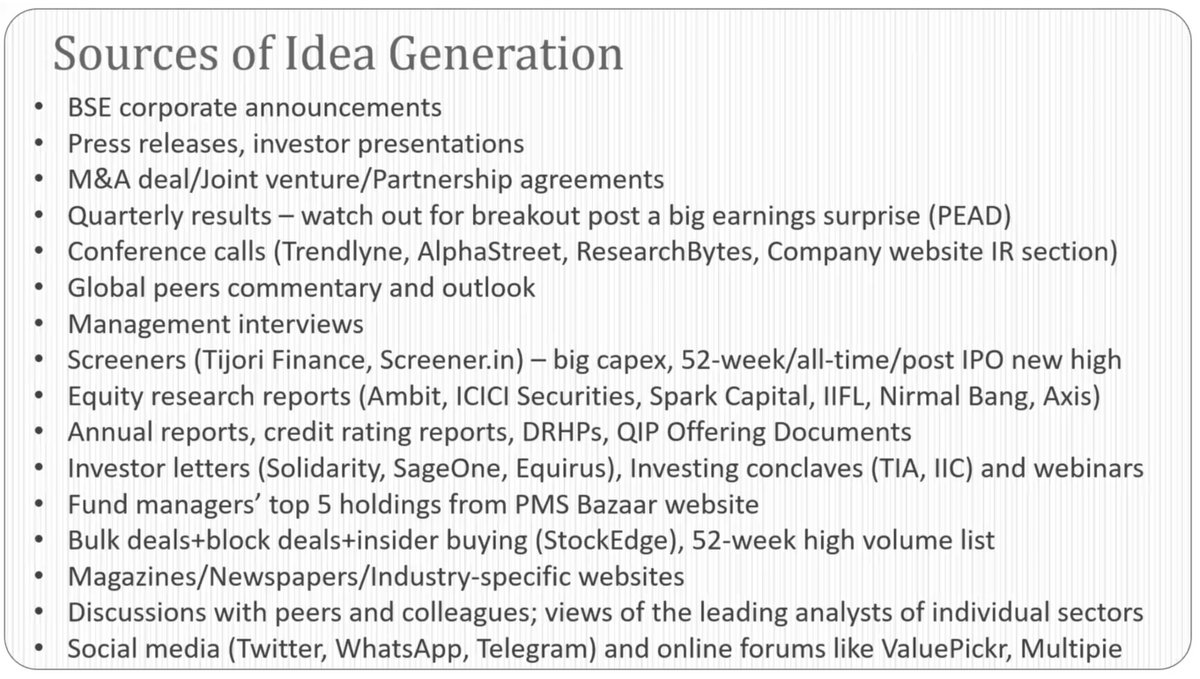
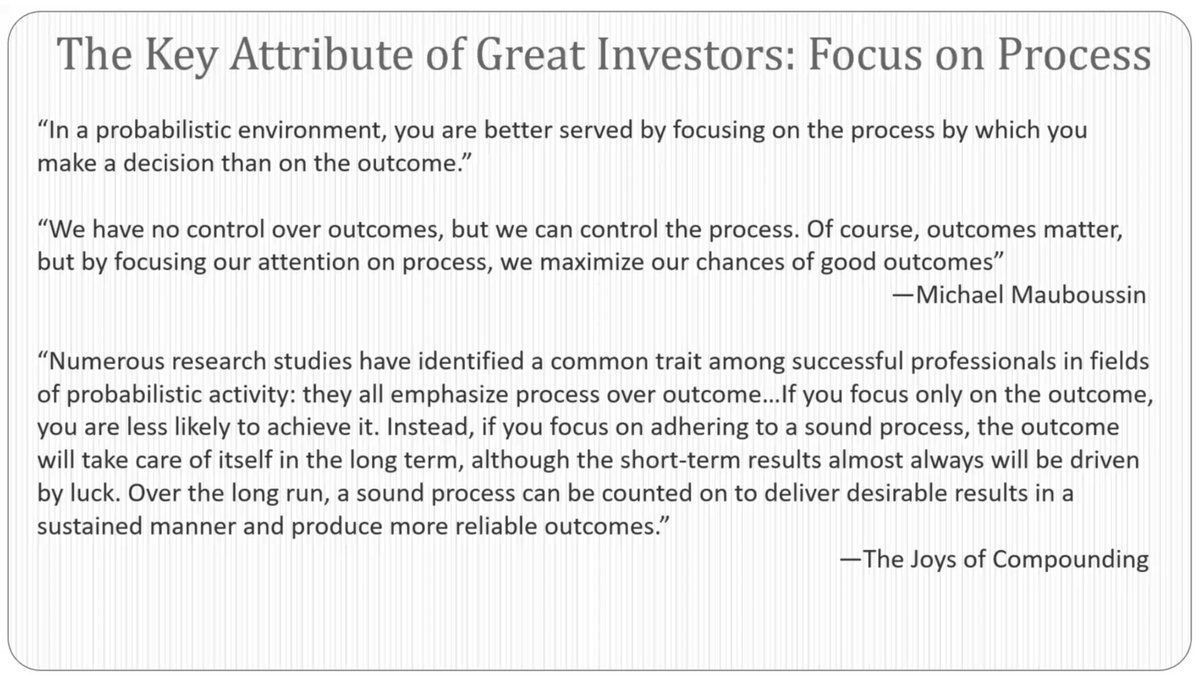
1/ Thoughts on Research Process
— Mostly Borrowed Ideas (@borrowed_ideas) September 27, 2021
I was invited to present my research process at a college in the US. I am sharing all ten slides here. pic.twitter.com/z0tjZcogfH
3. Reading annual reports
This is the bread and butter of a good business analyst.
You cannot just listen to opinions from others.
You must learn to deep dive a business and make your own judgments.
Start with the 10k.
Ming Zhao explains it
\U0001f9d0How to Read 10Ks Like a Hedge Fund\U0001f9d0
— Ming Zhao (@FabiusMercurius) May 7, 2021
\u201cFundamentals don\u2019t matter anymore!\u201d I\u2019ve heard this a lot lately on Fintwit.\U0001f644
But, for those who\u2019ve diversify beyond $GME and $DOGE, here\u2019s a primer on what metrics fundamental buy-side PMs look at and why:
(real examples outlined)
\U0001f447 pic.twitter.com/tLlNRvpnDK