The truly violent nature of the US neoliberal bipartisan political establishment is revealed in its commitment to funding racist, militarized police forces above funding healthcare & housing. The same ones who scoff at “defund police” also scoff at funding universal healthcare 1/
These are not individuals who oppose violence in principle but who instead want to monopolize the use of violence in their roles as gov’t officials & the political class. 4/
The performance of the inauguration matters b/c the “peaceful transition of power” has long been held as evidence of American exceptionalism & bipartisanship. 6/
More from Finance

Having made over 1000 boxes for vulnerable families in Cambridge via @RedHenCambridge (thanks to our customers 🙏🏽) My thoughts on the £30 box thing. Lots of factors at play here. 1/
If the pics in this @BootstrapCook thread are true and correct then the Govt/taxpayers & families in need are getting absolutely SHAFTED 👇🏽 2/
There are some mitigating circumstances. A £30 box won’t ever contain £30 (retail) worth of food - people aren’t factoring in
-the cost of the box
-paying someone to fill it
-rent & rates
-& most expensive the *transport/distribution*
3/
If you’re doing the above at scale. Delivering *across the UK* it’s not cheap BUT IMHO there should be at LEAST £20 worth of groceries in a £30 box. To get more value they need more fresh produce. Just carrots & apples is terrible. 4/
I’m gonna put my rep on the line here & say something about these big national catering companies whose names I’ve seen mentioned. They are an ASSHOLE to deal with & completely shaft small businesses like mine with their terms which is why I won’t deal with them. 5/
If the pics in this @BootstrapCook thread are true and correct then the Govt/taxpayers & families in need are getting absolutely SHAFTED 👇🏽 2/
Hi all. I\u2019ve been sent LOTS of photos of the food parcels that have replaced the \xa330 vouchers and asked what I would do with them. I\u2019m replying with advice privately because to do so publicly would look like justifying these ill thought through, offensively meagre scraps /1.
— Jack Monroe (@BootstrapCook) January 11, 2021
There are some mitigating circumstances. A £30 box won’t ever contain £30 (retail) worth of food - people aren’t factoring in
-the cost of the box
-paying someone to fill it
-rent & rates
-& most expensive the *transport/distribution*
3/
If you’re doing the above at scale. Delivering *across the UK* it’s not cheap BUT IMHO there should be at LEAST £20 worth of groceries in a £30 box. To get more value they need more fresh produce. Just carrots & apples is terrible. 4/
I’m gonna put my rep on the line here & say something about these big national catering companies whose names I’ve seen mentioned. They are an ASSHOLE to deal with & completely shaft small businesses like mine with their terms which is why I won’t deal with them. 5/


Ok here is the explanation. Grab a cup of coffee and read on. If you have not read/noticed this, you will see intraday options movement in a new light.
Say we have two options, one 50 delta ATM options and another 30 delta OTM option. Normally for a 100 point move, the ATM option will move 50 points and the OTM option will move 30 points. But in a high volatile environment, the OTM option will also move nearly 50 points
To understand why this happens, first understand why an ATM option is 50 delta. An ATM option has the probability of 50% of expiring as ITM. The price just has to close a rupee above the strike for the CE to be ITM and vice versa for PEs
Now think of a highly volatile day like today. If someone is asked where the BNF will close for the day or expiry, no one can answer. BNF can close freakin anywhere, That makes every option of an equal probability of being ITM. So all options have a 50% probability of being ITM
Hence, when a huge volatile move starts, all OTM options behave like ATM options. This phenomenon was first observed in the Black Monday crash of 1987 at Wall Street, which also gave rise to the volatility skew/smirk
In a high IV environment or when the market is very volatile
— Subhadip Nandy (@SubhadipNandy16) January 21, 2022
" OTM options will behave like ATM options", one will get almost the same delta movement
Say we have two options, one 50 delta ATM options and another 30 delta OTM option. Normally for a 100 point move, the ATM option will move 50 points and the OTM option will move 30 points. But in a high volatile environment, the OTM option will also move nearly 50 points
To understand why this happens, first understand why an ATM option is 50 delta. An ATM option has the probability of 50% of expiring as ITM. The price just has to close a rupee above the strike for the CE to be ITM and vice versa for PEs
Now think of a highly volatile day like today. If someone is asked where the BNF will close for the day or expiry, no one can answer. BNF can close freakin anywhere, That makes every option of an equal probability of being ITM. So all options have a 50% probability of being ITM
Hence, when a huge volatile move starts, all OTM options behave like ATM options. This phenomenon was first observed in the Black Monday crash of 1987 at Wall Street, which also gave rise to the volatility skew/smirk

Buffett's letters taught me more about investing than any business school ever could.
Even after investing for 14 years, I uncover new insights every time I reread his letters.
Recently, I reread his letters from 1977 to 2020 for a third time.
Here are my key insights:

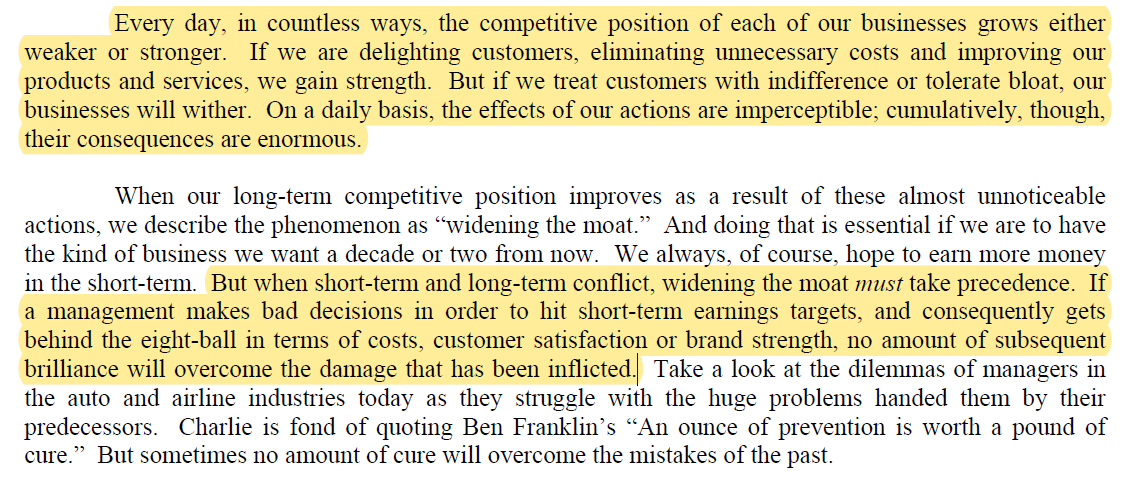
1. Moat is NEVER stagnant
A company's competitive position either grows stronger or weaker each day.
Widening the moat must always take precedence over short-term targets.
2. Commodity businesses
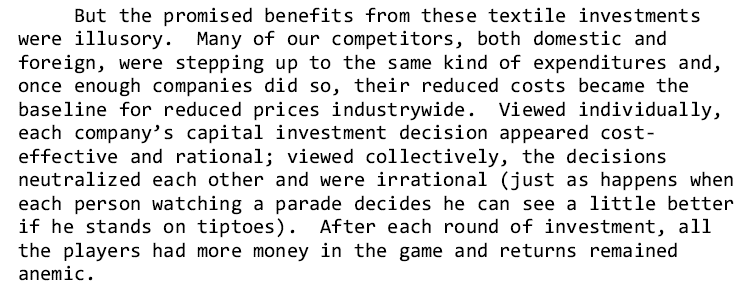
A business without moat will have its returns competed away.
Regardless of improvement, your competitors will quickly copy your advantage away.
Where returns on capital is dismal, reinvestment will only destroy value.
3. The flywheel effect
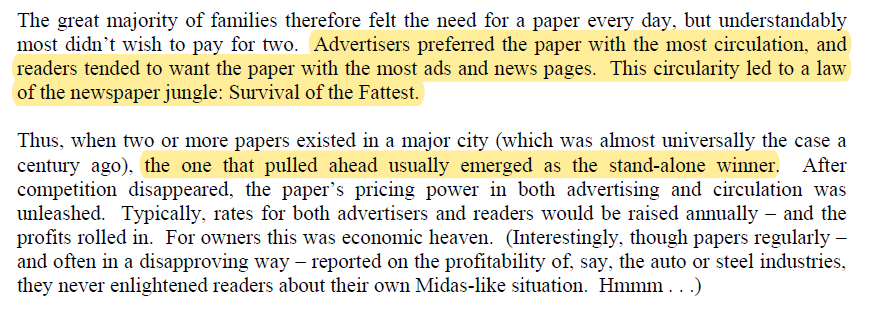
Buffett was preaching about the flywheel effect before it became cool.
Back then, newspapers were similar to today's platform businesses like Amazon, Meta, and App Store.
More readers beget more advertisers beget more readers.
4. Operating leverage
Companies with high fixed costs and low variable costs will see earnings rise faster than revenue.
However, it cuts both ways.
It becomes a disaster when revenue is declining.
Check out my article on how operating leverage works: https://t.co/Nv747oBAK0

Even after investing for 14 years, I uncover new insights every time I reread his letters.
Recently, I reread his letters from 1977 to 2020 for a third time.
Here are my key insights:
1. Moat is NEVER stagnant
A company's competitive position either grows stronger or weaker each day.
Widening the moat must always take precedence over short-term targets.
2. Commodity businesses
A business without moat will have its returns competed away.
Regardless of improvement, your competitors will quickly copy your advantage away.
Where returns on capital is dismal, reinvestment will only destroy value.
3. The flywheel effect
Buffett was preaching about the flywheel effect before it became cool.
Back then, newspapers were similar to today's platform businesses like Amazon, Meta, and App Store.
More readers beget more advertisers beget more readers.
4. Operating leverage
Companies with high fixed costs and low variable costs will see earnings rise faster than revenue.
However, it cuts both ways.
It becomes a disaster when revenue is declining.
Check out my article on how operating leverage works: https://t.co/Nv747oBAK0