๐ŸฉธFIBONACCI retracement and GOLDEN RATIO - PART 2

Before we move forward, kindly like and retweet if you find our content is adding something to your knowledge.

We have described how interesting Fibonacci numbers and ratios are and how it's been formed in PART 1 of this series. In PART 2, Lets see how we take trade based on fibo.
๐ŸŽฏHow to draw Fibonacci levels?
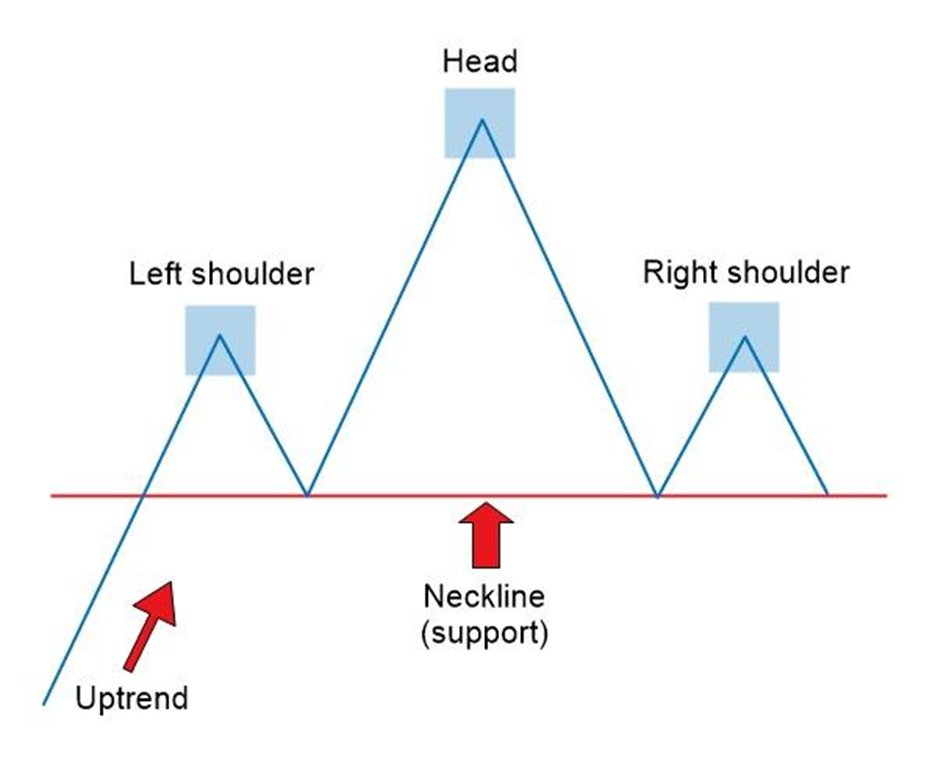
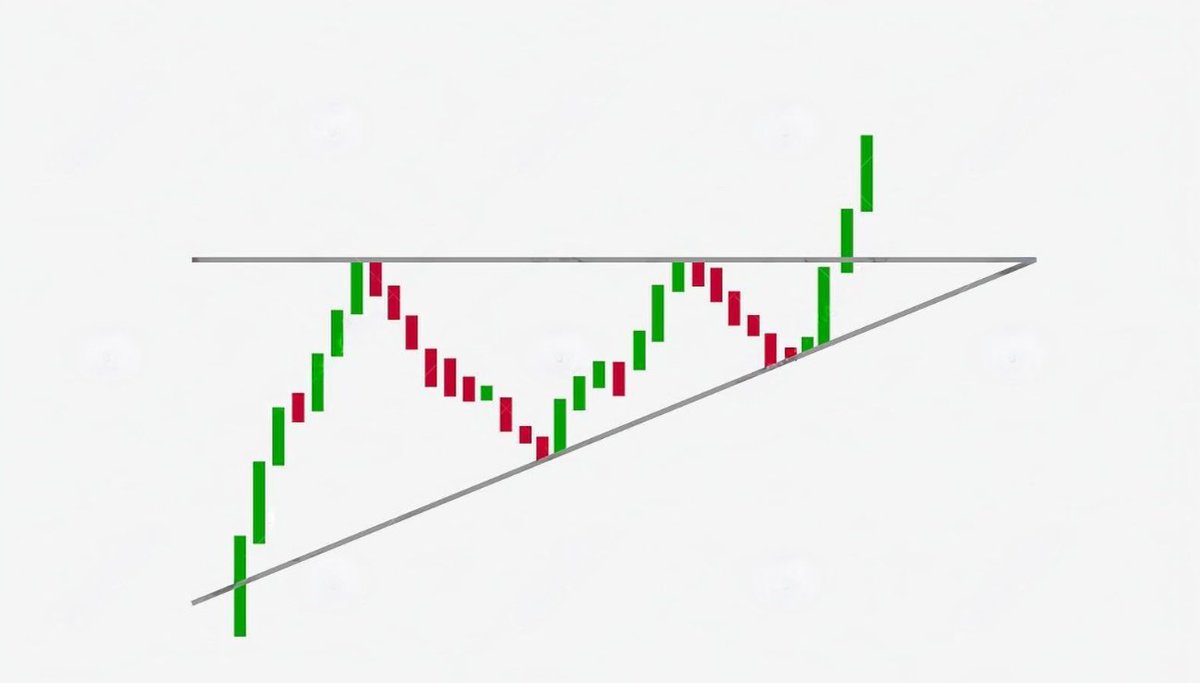
Drawing Fibonacci retracemnts are fairly simple. The main point we look into is, If the direction of retracment is up or down side.
โœ… If the trend is up, choose lower point and a higher point. Connect lower point with higher point using Fibo tool.
โœ… If the trend is down, choose higher point and a lower point. Connect higher point with lower point using Fibo retracement tool.
๐ŸŽฏHow to choose lower and higher points to connect?
โœ…Take lower point as point from where the trend has started, which means one should not take points where consolidation was going on.
โœ…Similarly, for higher point, choose the point from where the retracement of trend has started.
The choice of points is debatable. There is no fixed method. But above mentioned technique works and has a fair probability of success.
๐ŸŽฏWhich fibo ratio has a higher probability of success?
โœ…0.618
โœ…0.5
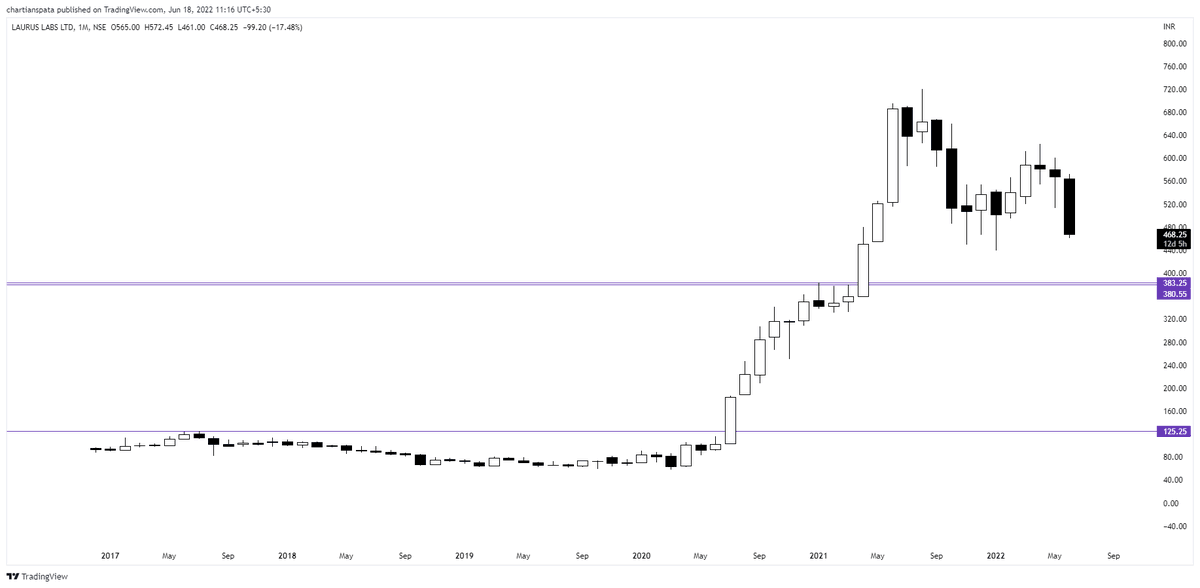
In an up trending stock, If stock starts consolidating and reversing from 0.618 of retracement, we term it as bullish sign and trend is going to be continued towards new high.
If the stock is hovering between 0.618 and 0.5, it can also be termed as bullish sign, but we can wait for small dip towards 0.618 levels and enter OR we can enter in parts of quantity. We always have to keep some buffer point below 0.618 as STOP LOSS
๐ŸŽฏOnce you find out such stock and enter, ride the trend towards new highs. All other ratios can be ignored or can be monitored to see if the stock is taking resistance at those levels.
๐ŸŽฏIf you find any swing supports/resistance at 0.5,0.618 levels, its an added advantage to the conviction and pick can do wonders and give higher probability of winning
๐ŸŽฏTime frame can be daily and weekly charts
๐ŸŽฏHere is one example where we have taken the trade and rid the trend.
๐ŸŽฏWe have several techniques to take a trade in the technical world. But practice one or two methods repeatedly and master it. Don't be a victim of analysis paralysis by applying every method.
๐ŸŽฏOne ongoing stock based on fibo is below. Lets see how it performs in coming days..
๐ŸŽฏThe method is not foolproof. But has higher chances of winning. After all, market is supreme.

LIKE and RETWEET if you found the knowledge is worth sharing.
@jigspatel1988 @caniravkaria @chartmojo @CAPratik_INDIAN @_GauravVashisth @RajarshitaS
@kach0289 @asarvindsharma @hjyadav @ca_mehtaravi @TechCharts
#stockmarket #stockmarketindia #stockmarketmemes #stockmarketnews #chartians #monentum #trading
#intraday #stockmarket #sharemarket #priceaction #investing #trading #daytrader #nse #bse #banknifty #nifty #itc #adani #nifty50 #yesbank #harshadmehta #rakesh #jhunjhunwala #itc

More from The Chartians

More from Fibonacci

You May Also Like

๐™Ž๐™๐™–๐™ง๐™ž๐™ฃ๐™œ ๐™ข๐™ฎ ๐™ฌ๐™ž๐™จ๐™™๐™ค๐™ข ๐‘พ๐’๐’'๐’• ๐’ƒ๐’† ๐’”๐’–๐’“๐’‘๐’“๐’Š๐’”๐’†๐’… ๐’Š๐’‡ ๐’•๐’๐’Ž๐’๐’“๐’“๐’๐’˜ ๐’– ๐’“๐’†๐’‚๐’… ๐’•๐’‰๐’† ๐’”๐’‚๐’Ž๐’† ๐’”๐’•๐’–๐’‡๐’‡ ๐’Š๐’ 50๐’Œ ๐’˜๐’๐’“๐’Œ๐’”๐’‰๐’๐’‘ ๐’๐’“ ๐’”๐’๐’Ž๐’†๐’๐’๐’† ๐’Ž๐’‚๐’๐’‚๐’ˆ๐’Š๐’๐’ˆ ๐’š๐’๐’–๐’“ ๐’Ž๐’๐’๐’†๐’š ๐’˜๐’Š๐’•๐’‰ ๐’”๐’‚๐’Ž๐’† ๐’๐’๐’ˆ๐’Š๐’„
Simple and effective way 2 make Money


Idea 1:- Use pivot level like 14800 in case of nifty and sell 14800straddle monthly expiry (365+335) exit if nifty closes on daily basis below S1 or above R1

After closing below S1 if it closes above S1 next day or any day enter the same position again vice versa for R1

Idea2:- Use R1 and S1 corresponding strikes multiple
Incase of R1 15337 take 15300ce
N in case of S1 14221 use 14200pe
Sell both and hold till expiry or exit if nifty closes below S1 or above R1 around closing
If the same bounces above S1 and falls below R1 re-enfer same strikes

Use same criteria for nifty, usdinr and banknifty

(This is must)Use this margin rule for 1lot banknifty pair keep 4Lax margin
For nifty one lot keep 3Lax
For usdinr 100lots keep 4Lax

I bet you if you do this on consistent basis your ROI will be more than 70% on yearly basis.

Couldn't explain easier than this

Criticisms are most welcomed.