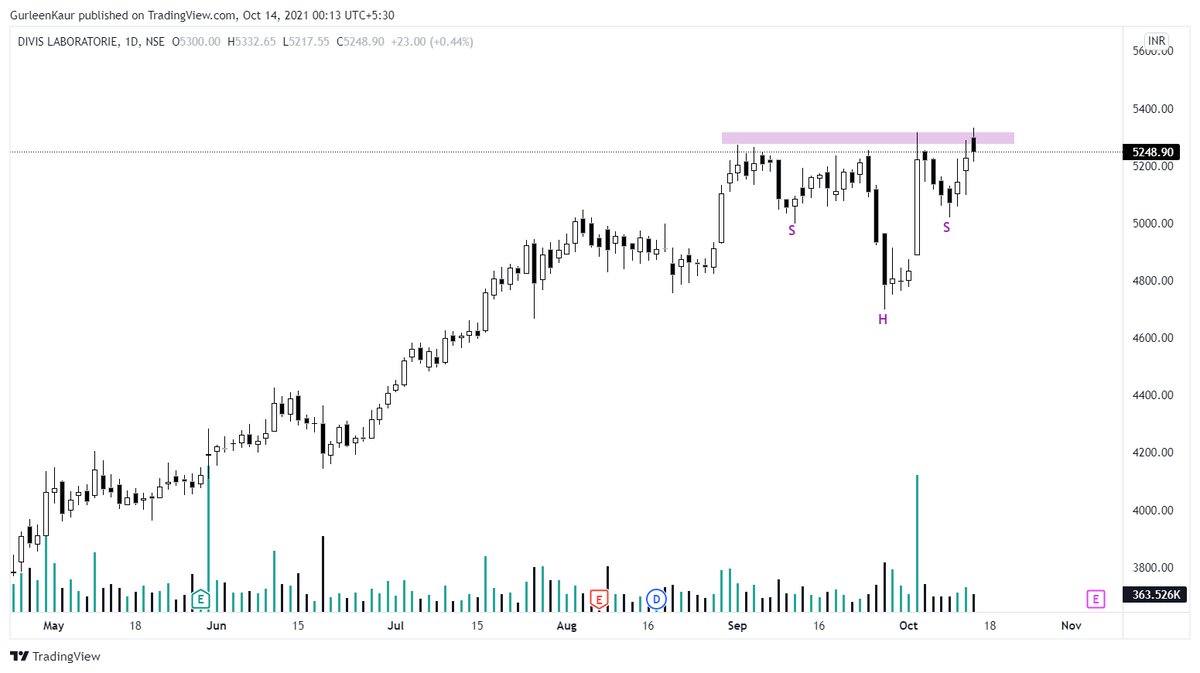
#Divis - #weekly
Reverse C & H in formation, any breakdown can lead to massive gap filling. 📈
@CAPratik_INDIAN @chartmojo @ca_mehtaravi

More from SACHIN JAIN 🇮🇳


More from Divis


You May Also Like

This is NONSENSE. The people who take photos with their books on instagram are known to be voracious readers who graciously take time to review books and recommend them to their followers. Part of their medium is to take elaborate, beautiful photos of books. Die mad, Guardian.
THEY DO READ THEM, YOU JUDGY, RACOON-PICKED TRASH BIN

If you come for Bookstagram, i will fight you.
In appreciation, here are some of my favourite bookstagrams of my books: (photos by lit_nerd37, mybookacademy, bookswrotemystory, and scorpio_books)

Beautifully read: why bookselfies are all over Instagram https://t.co/pBQA3JY0xm
— Guardian Books (@GuardianBooks) October 30, 2018
THEY DO READ THEM, YOU JUDGY, RACOON-PICKED TRASH BIN
If you come for Bookstagram, i will fight you.
In appreciation, here are some of my favourite bookstagrams of my books: (photos by lit_nerd37, mybookacademy, bookswrotemystory, and scorpio_books)

@franciscodeasis https://t.co/OuQaBRFPu7
Unfortunately the "This work includes the identification of viral sequences in bat samples, and has resulted in the isolation of three bat SARS-related coronaviruses that are now used as reagents to test therapeutics and vaccines." were BEFORE the

chimeric infectious clone grants were there.https://t.co/DAArwFkz6v is in 2017, Rs4231.
https://t.co/UgXygDjYbW is in 2016, RsSHC014 and RsWIV16.
https://t.co/krO69CsJ94 is in 2013, RsWIV1. notice that this is before the beginning of the project
starting in 2016. Also remember that they told about only 3 isolates/live viruses. RsSHC014 is a live infectious clone that is just as alive as those other "Isolates".
P.D. somehow is able to use funds that he have yet recieved yet, and send results and sequences from late 2019 back in time into 2015,2013 and 2016!
https://t.co/4wC7k1Lh54 Ref 3: Why ALL your pangolin samples were PCR negative? to avoid deep sequencing and accidentally reveal Paguma Larvata and Oryctolagus Cuniculus?
Unfortunately the "This work includes the identification of viral sequences in bat samples, and has resulted in the isolation of three bat SARS-related coronaviruses that are now used as reagents to test therapeutics and vaccines." were BEFORE the
chimeric infectious clone grants were there.https://t.co/DAArwFkz6v is in 2017, Rs4231.
https://t.co/UgXygDjYbW is in 2016, RsSHC014 and RsWIV16.
https://t.co/krO69CsJ94 is in 2013, RsWIV1. notice that this is before the beginning of the project
starting in 2016. Also remember that they told about only 3 isolates/live viruses. RsSHC014 is a live infectious clone that is just as alive as those other "Isolates".
P.D. somehow is able to use funds that he have yet recieved yet, and send results and sequences from late 2019 back in time into 2015,2013 and 2016!
https://t.co/4wC7k1Lh54 Ref 3: Why ALL your pangolin samples were PCR negative? to avoid deep sequencing and accidentally reveal Paguma Larvata and Oryctolagus Cuniculus?