
#CNXIT -26770
Weekly chart. https://t.co/YVjvgZIy0Y
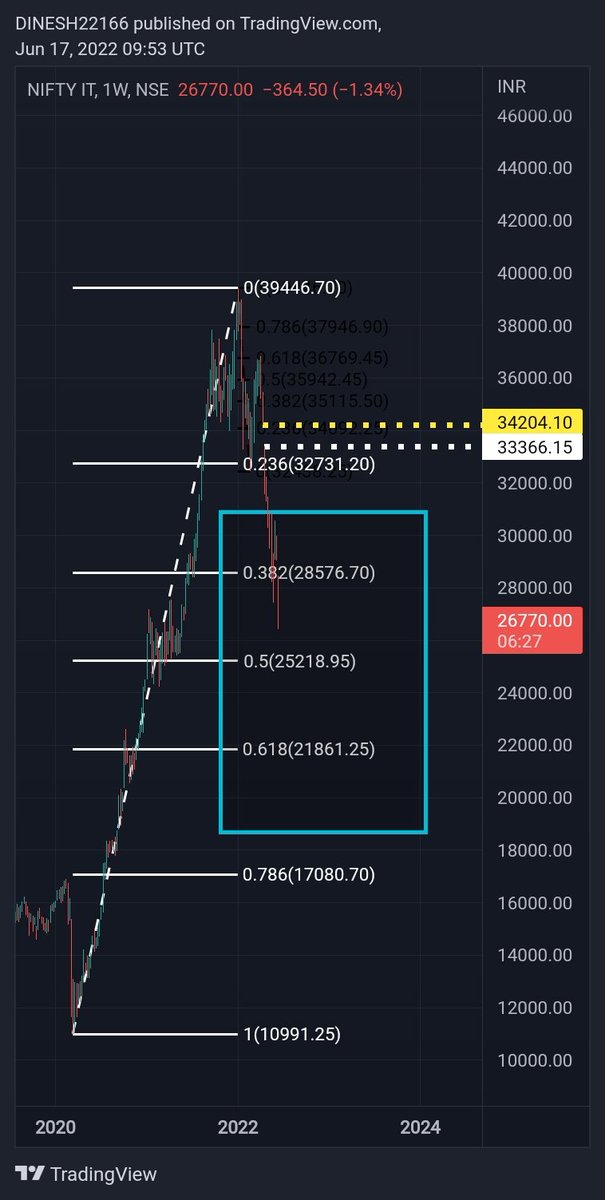
#CNXIT
— Waves_Perception(Dinesh Patel) \u092e\u0948\u0902Schedule Tribe) (@idineshptl) May 26, 2022
Weekly chart.
Minor pullback before further downside.
Respecting #Fibonacci retracement level 0.382%#Probability pic.twitter.com/y2JvoIikDI
More from Waves_Perception(Dinesh Patel) मैंSchedule Tribe)

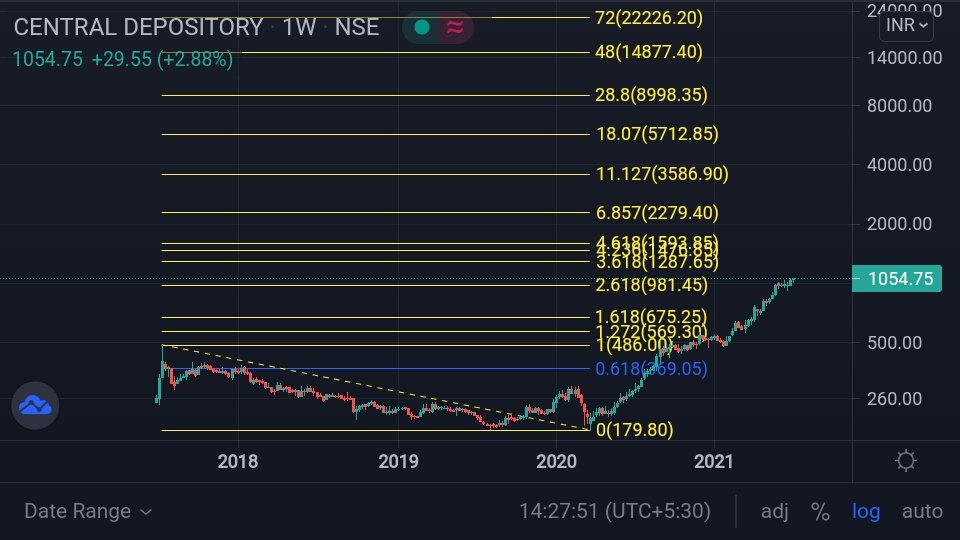
Probability towards 4.618% and beyond..
#Possibility
#LTI -4145
— MaRkET WaVES (DINESH PATEL ) Stock Market FARMER (@idineshptl) July 14, 2021
Near term base Case (4024)
Look for 4.618% and 6.857%
Long term perspective Fibonacci extension shown in chart. #Perspective pic.twitter.com/Pyl0aGYIuS
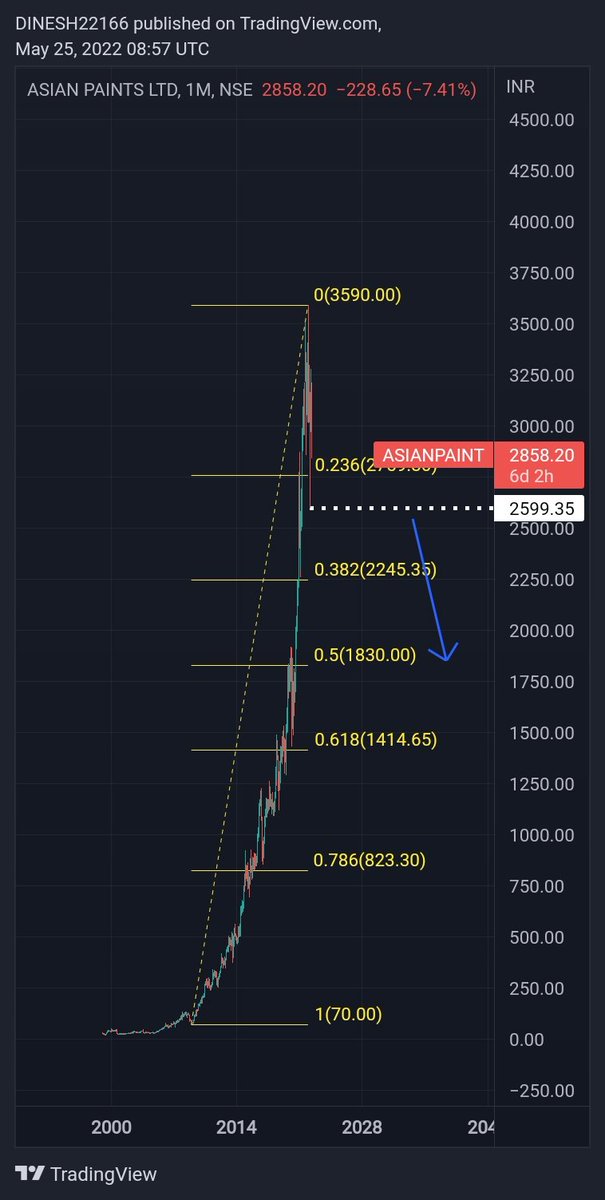
#ASIANPAINT-2931
— Waves_Perception(Dinesh Patel) \u092e\u0948\u0902Schedule Tribe) (@idineshptl) March 3, 2022
Trend down.
Weekly chart. Fibonacci retracement level shown in chart.
Near term 0.236% and 0.382% Fibonacci retracement level likely to be tested.#Perspective pic.twitter.com/cWJ0qaqDhK
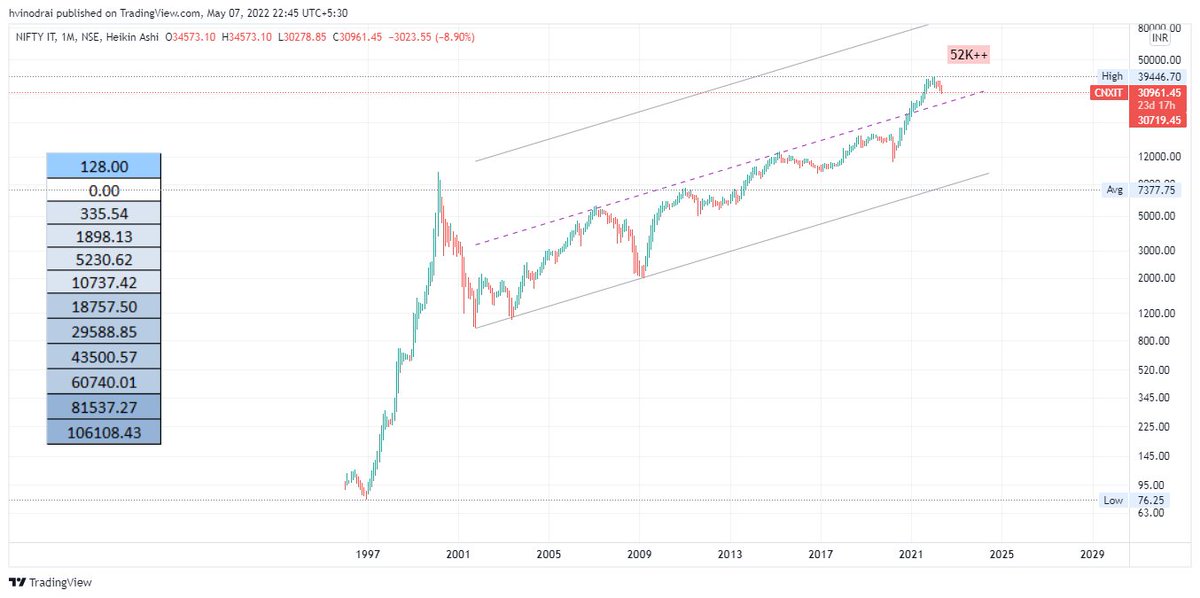
What a beautiful picture
#Wow
एक कलर #लाल भी है
More from Cnxitlongterm


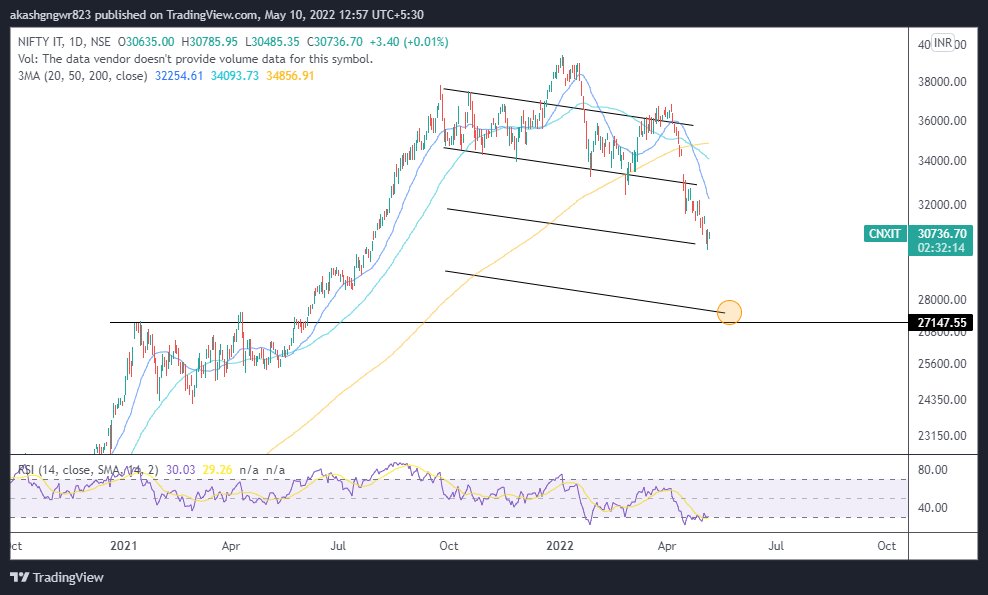
#CNXIT https://t.co/bJeKTMoCji
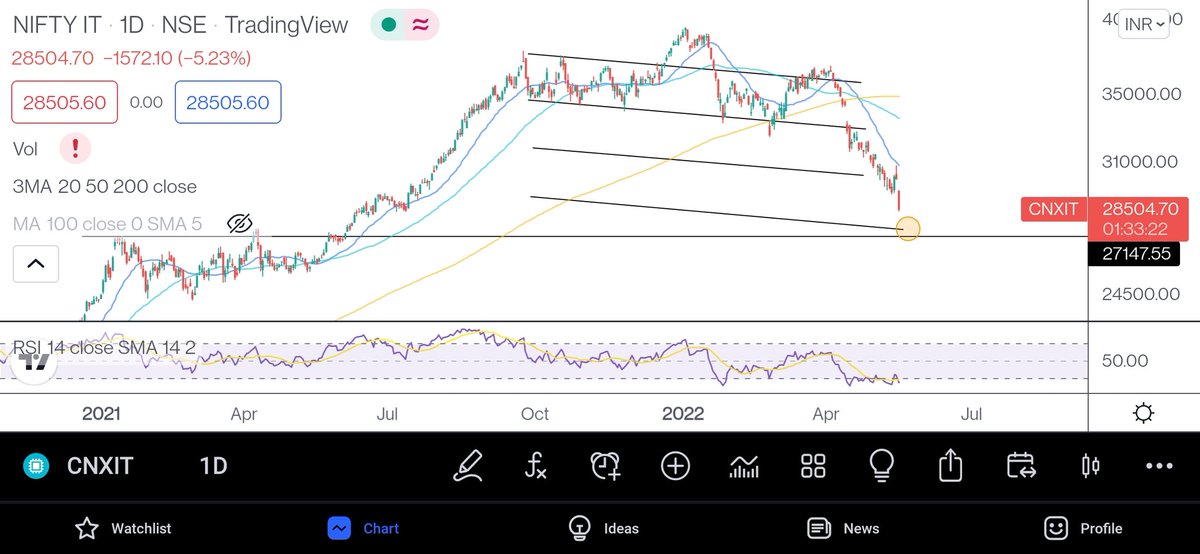
The current formation might look like a falling wedge, but the way moving averages are placed, it looks like a falling wedge which can lead to a parabolic downmove for the marked target. #CNXIT pic.twitter.com/GmXOI3HmUN
— Aakash Gangwar (@akashgngwr823) May 10, 2022


You May Also Like


1 - open trading view in your browser and select stock scanner in left corner down side .
2 - touch the percentage% gain change ( and u can see higest gainer of today)
Making thread \U0001f9f5 on trading view scanner by which you can select intraday and btst stocks .
— Vikrant (@Trading0secrets) October 22, 2021
In just few hours (Without any watchlist)
Some manual efforts u have to put on it.
Soon going to share the process with u whenever it will be ready .
"How's the josh?"guys \U0001f57a\U0001f3b7\U0001f483
3. Then, start with 6% gainer to 20% gainer and look charts of everyone in daily Timeframe . (For fno selection u can choose 1% to 4% )
4. Then manually select the stocks which are going to give all time high BO or 52 high BO or already given.
5. U can also select those stocks which are going to give range breakout or already given range BO
6 . If in 15 min chart📊 any stock sustaing near BO zone or after BO then select it on your watchlist
7 . Now next day if any stock show momentum u can take trade in it with RM
This looks very easy & simple but,
U will amazed to see it's result if you follow proper risk management.
I did 4x my capital by trading in only momentum stocks.
I will keep sharing such learning thread 🧵 for you 🙏💞🙏
Keep learning / keep sharing 🙏
@AdityaTodmal
