
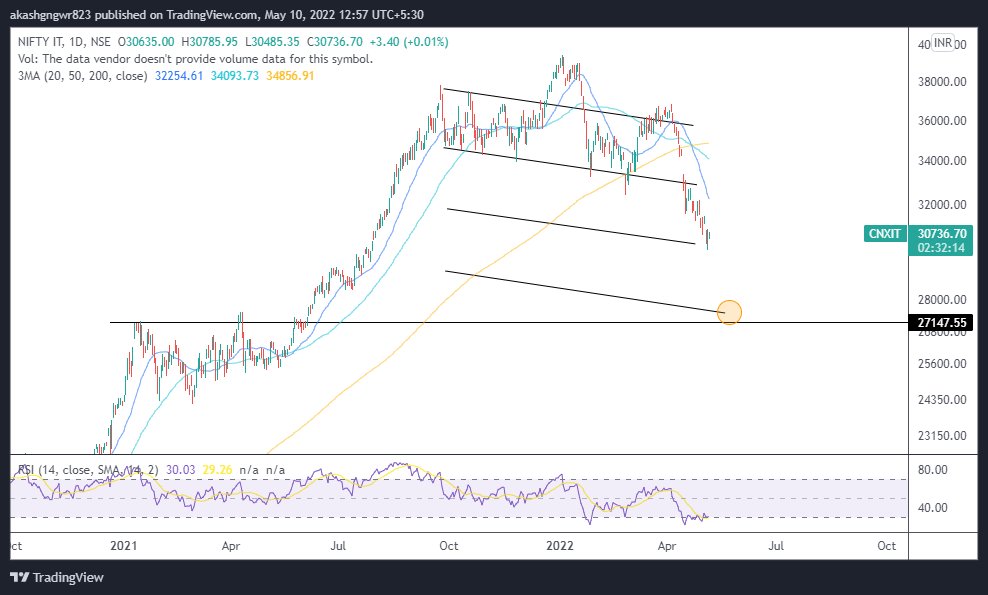
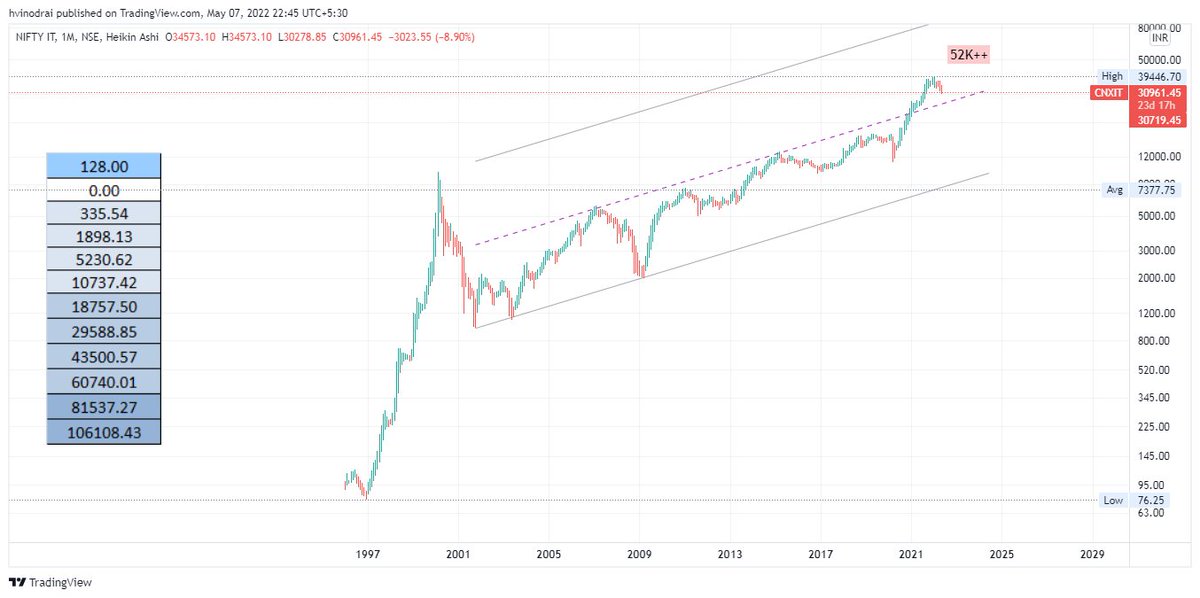
The current formation might look like a falling wedge, but the way moving averages are placed, it looks like a falling wedge which can lead to a parabolic downmove for the marked target.
#CNXIT
More from Aakash Gangwar
#Nifty50 https://t.co/ajpEwosu3v
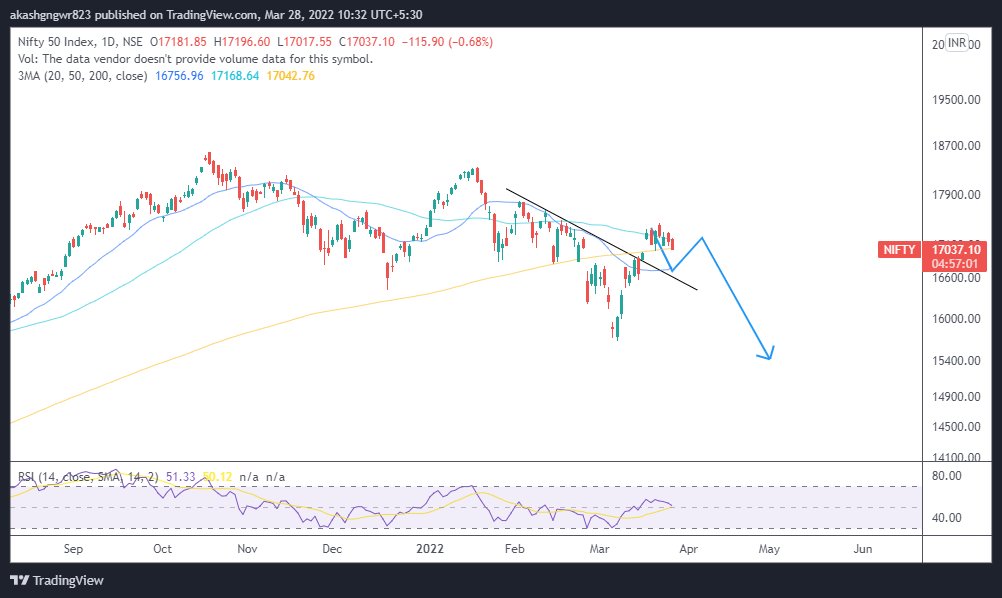
JK bhai let's have fake breakout in Nifty \U0001f61c
— Aakash Gangwar (@akashgngwr823) March 10, 2022
Not joking though, have a reason to anticipate that. https://t.co/idzSRIpWga pic.twitter.com/MNsTm3Mron
#bearrun
#BearMarket
Head & Shoulders pattern, double top and bearish RSI divergences fail more often in bull market and generally gives a very good SAR trade. Vice versa is also true for bear market.#bullrun #BullMarket
— Aakash Gangwar (@akashgngwr823) February 9, 2021
#CNXIT
Watching the marked zone to be tested. If it doesn't cross it, then most probably a parabolic downmove towards 24k. That would lead to even large caps cracking just like Small and Midcaps. #CNXIT https://t.co/FxbzP5vlBr pic.twitter.com/FSqcSqTQM9
— Aakash Gangwar (@akashgngwr823) June 21, 2022
#nifty50 https://t.co/64ZktWHQev
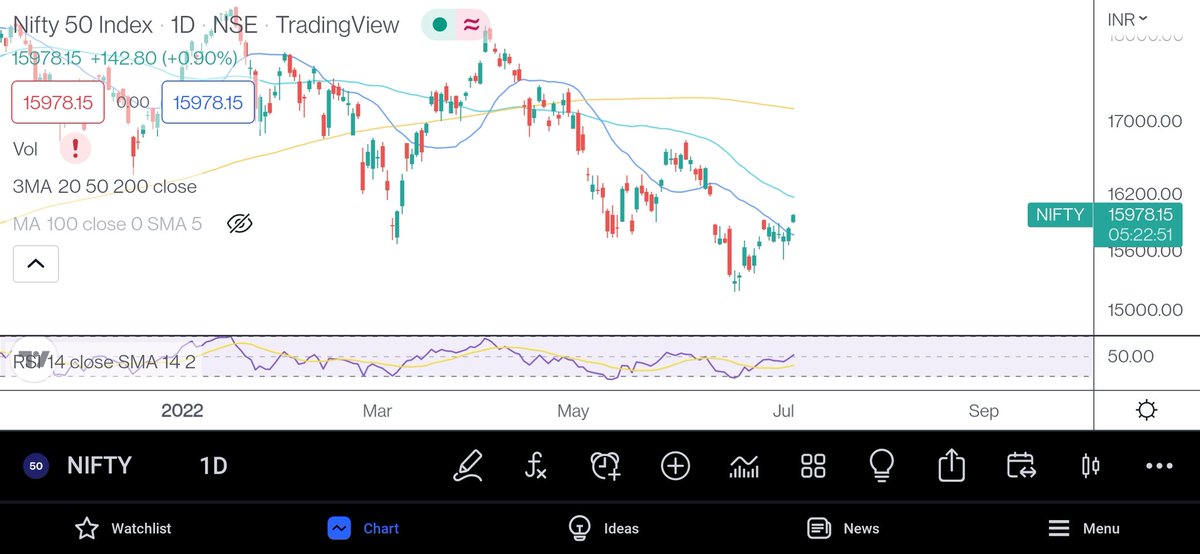
This is the maximum upside for now, post that I am looking for an 8-9% fall in index.#nifty50 pic.twitter.com/BcSOiwWuBs
— Aakash Gangwar (@akashgngwr823) June 24, 2022
More from Cnxitlongterm



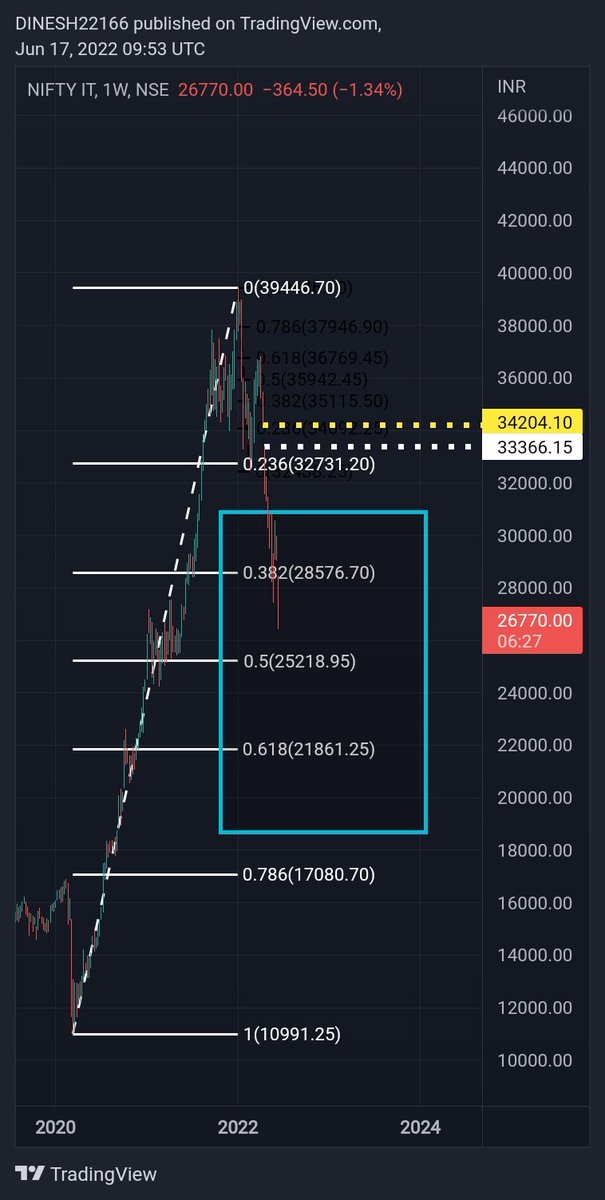

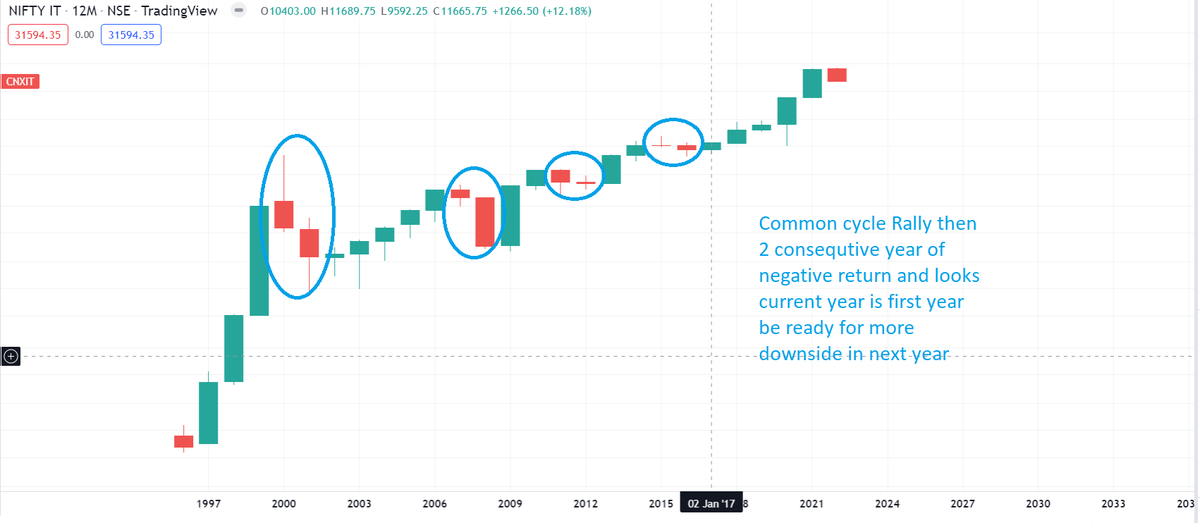
#CNXIT
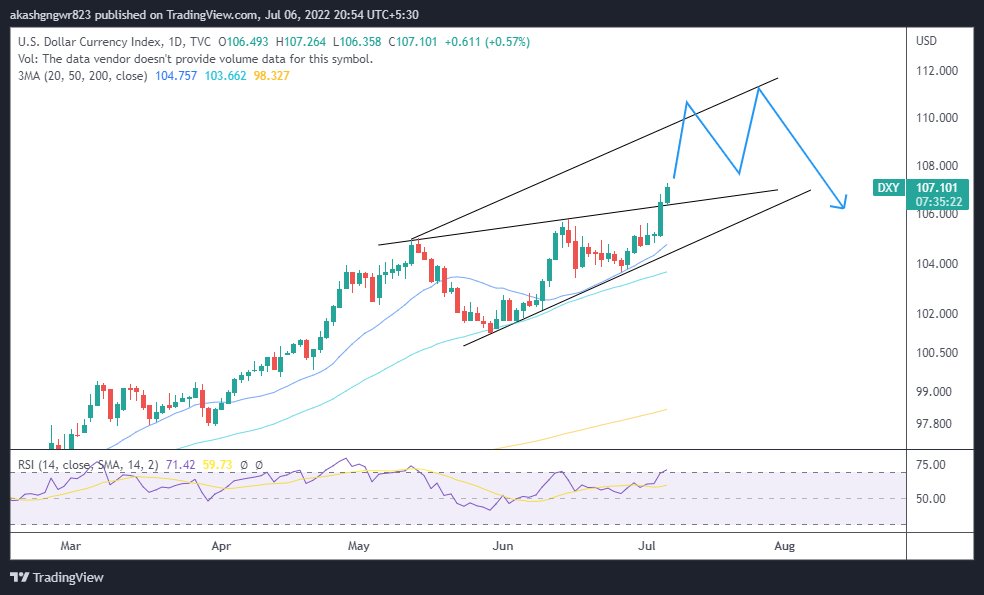
Watching the marked zone to be tested. If it doesn't cross it, then most probably a parabolic downmove towards 24k. That would lead to even large caps cracking just like Small and Midcaps. #CNXIT https://t.co/FxbzP5vlBr pic.twitter.com/FSqcSqTQM9
— Aakash Gangwar (@akashgngwr823) June 21, 2022
You May Also Like




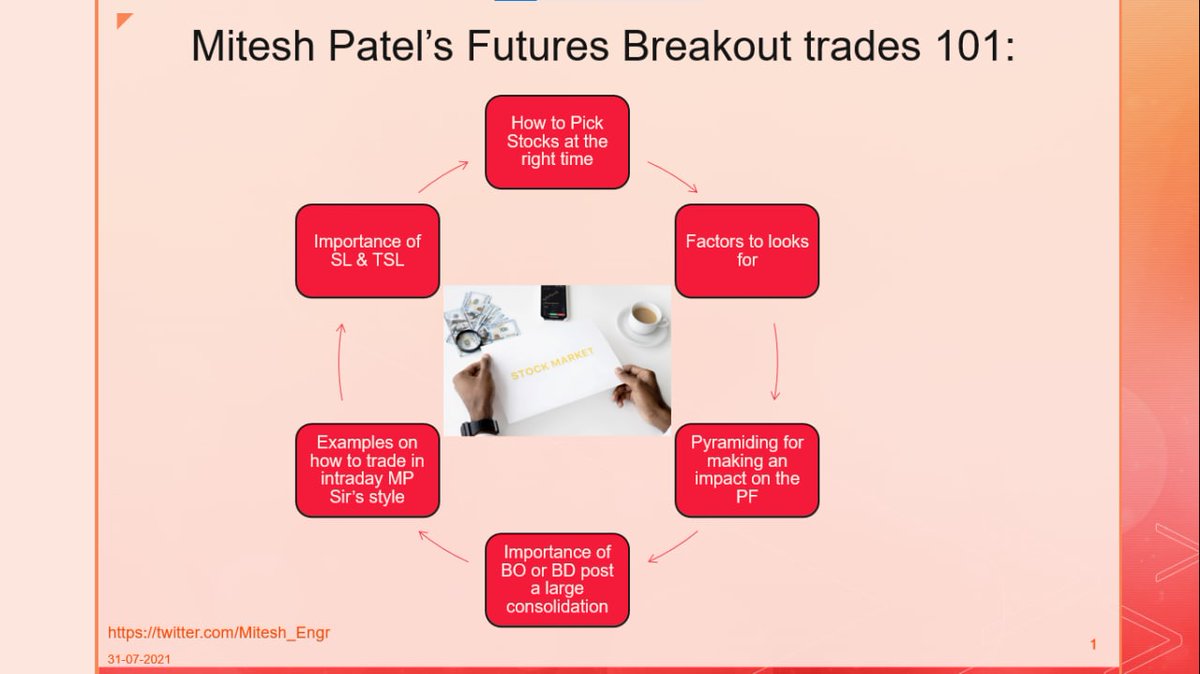
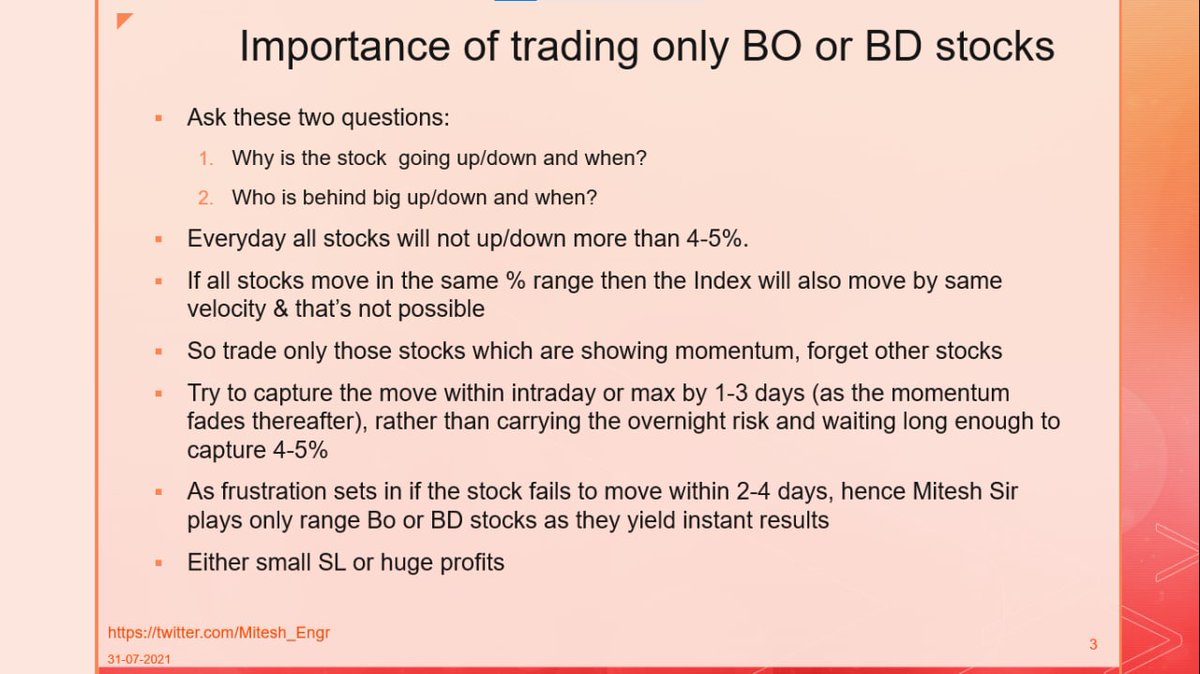







Here I will share what I believe are essentials for anybody who is interested in stock markets and the resources to learn them, its from my experience and by no means exhaustive..
First the very basic : The Dow theory, Everybody must have basic understanding of it and must learn to observe High Highs, Higher Lows, Lower Highs and Lowers lows on charts and their
Even those who are more inclined towards fundamental side can also benefit from Dow theory, as it can hint start & end of Bull/Bear runs thereby indication entry and exits.
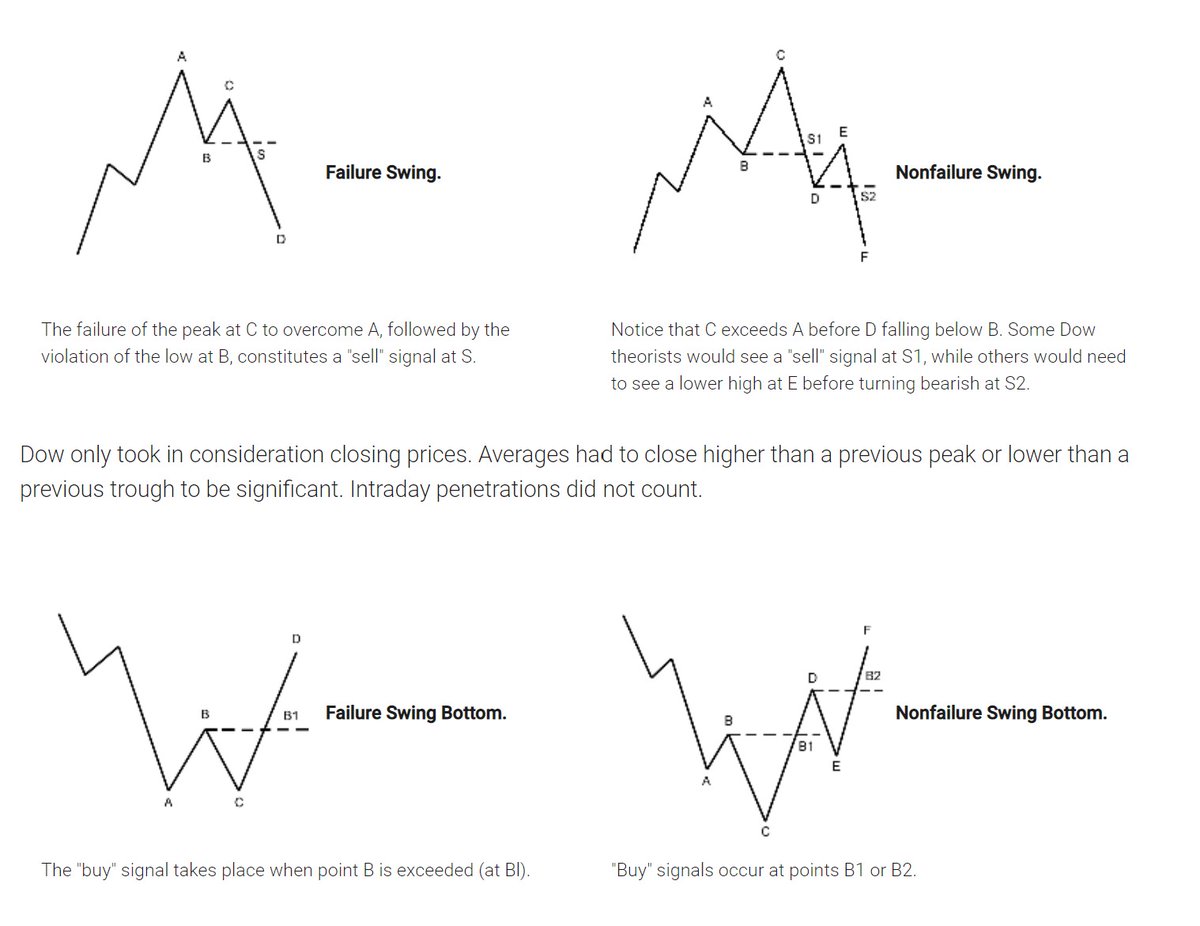
Next basic is Wyckoff's Theory. It tells how accumulation and distribution happens with regularity and how the market actually
Dow theory is old but
Old is Gold....
— Professor (@DillikiBiili) January 23, 2020
this Bharti Airtel chart is a true copy of the Wyckoff Pattern propounded in 1931....... pic.twitter.com/tQ1PNebq7d