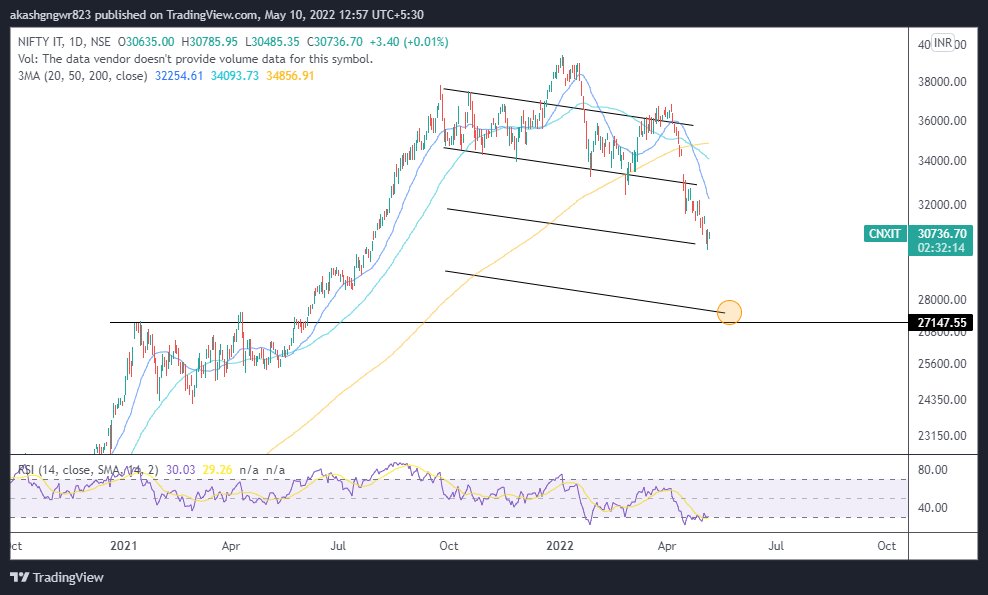
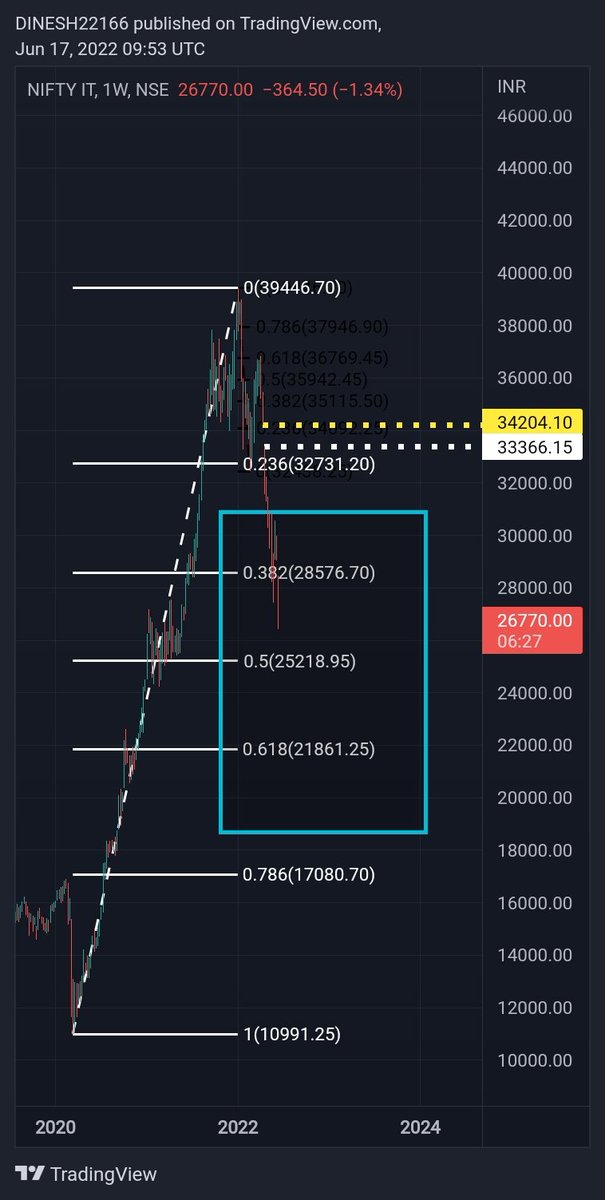
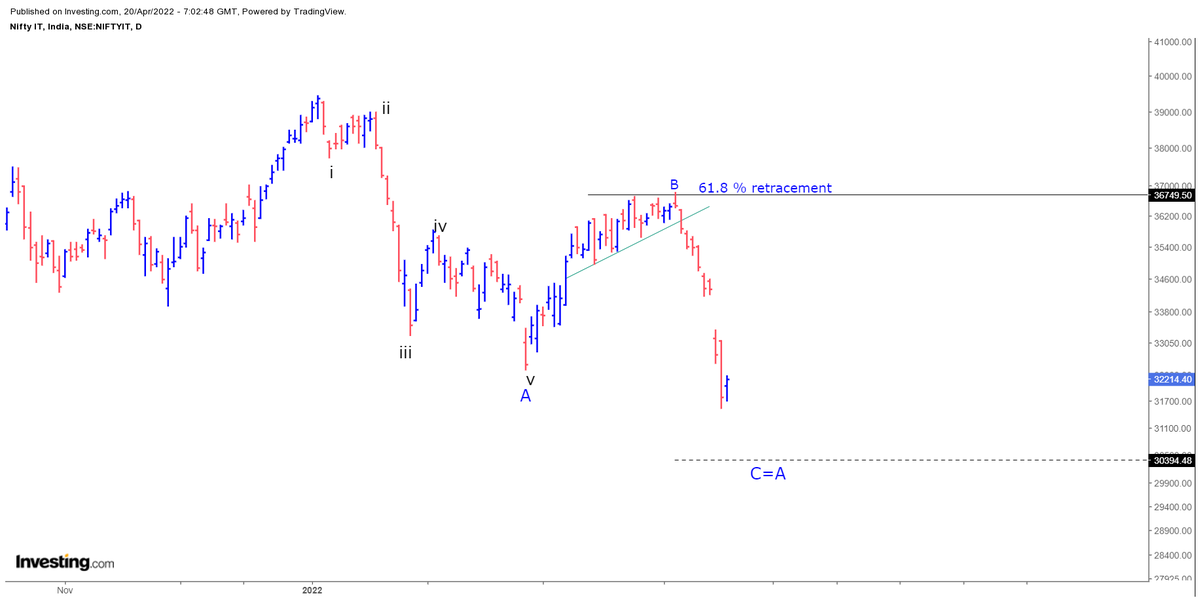
Parabolic move has been triggered. Let's have 27k. That could be the buying zone for IT names.
#CNXIT https://t.co/bJeKTMoCji
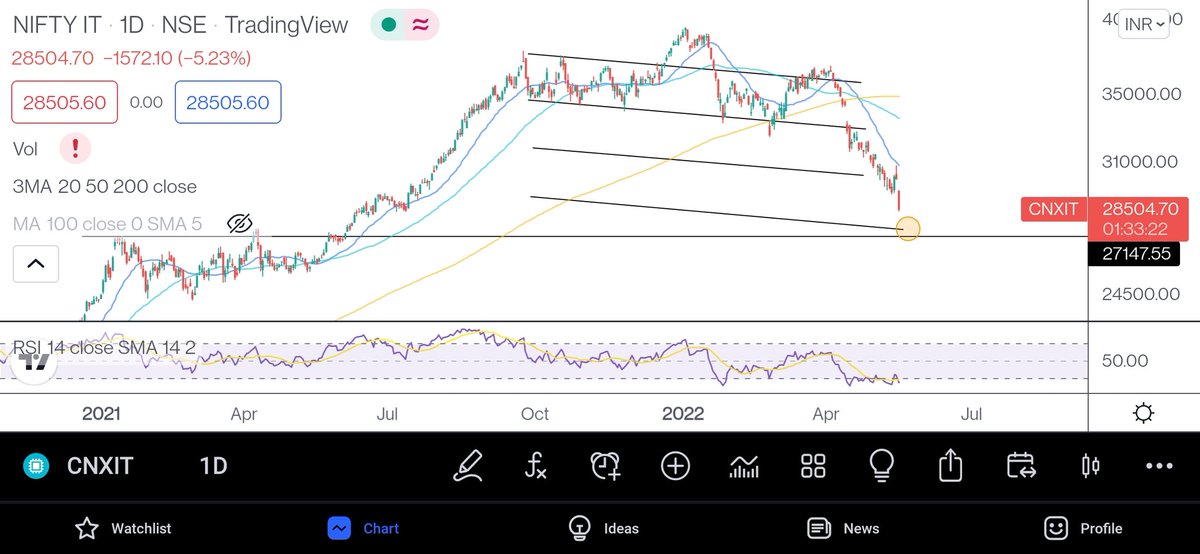
The current formation might look like a falling wedge, but the way moving averages are placed, it looks like a falling wedge which can lead to a parabolic downmove for the marked target. #CNXIT pic.twitter.com/GmXOI3HmUN
— Aakash Gangwar (@akashgngwr823) May 10, 2022
More from Aakash Gangwar
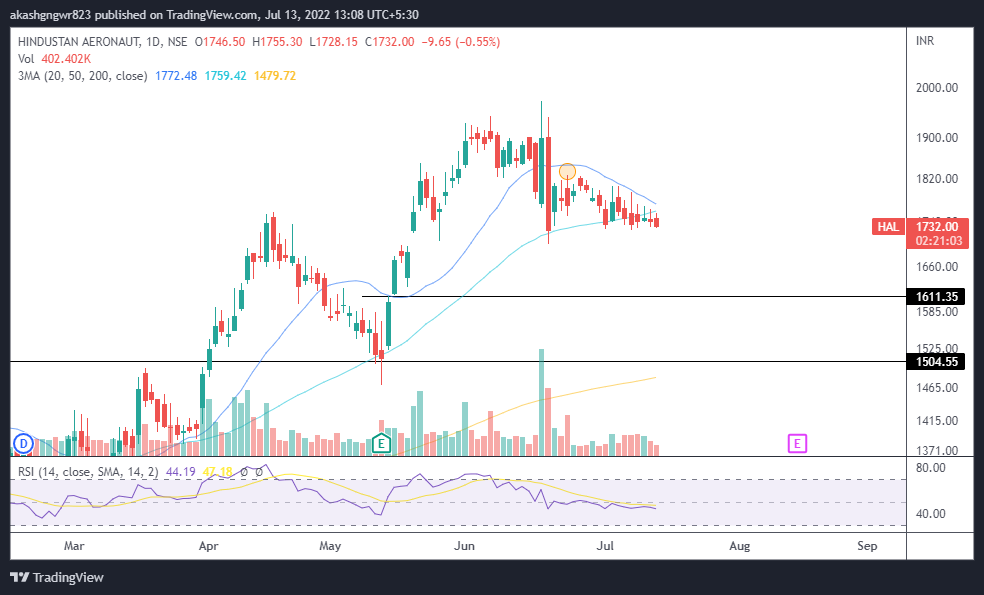
We often hear that prediction in markets is a nasty game, but we don't really have to believe everything we read on social media. Do we? As long as you maintain good accuracy in your predictions, you will do absolutely great.
#CNXIT https://t.co/w3qedea7T6
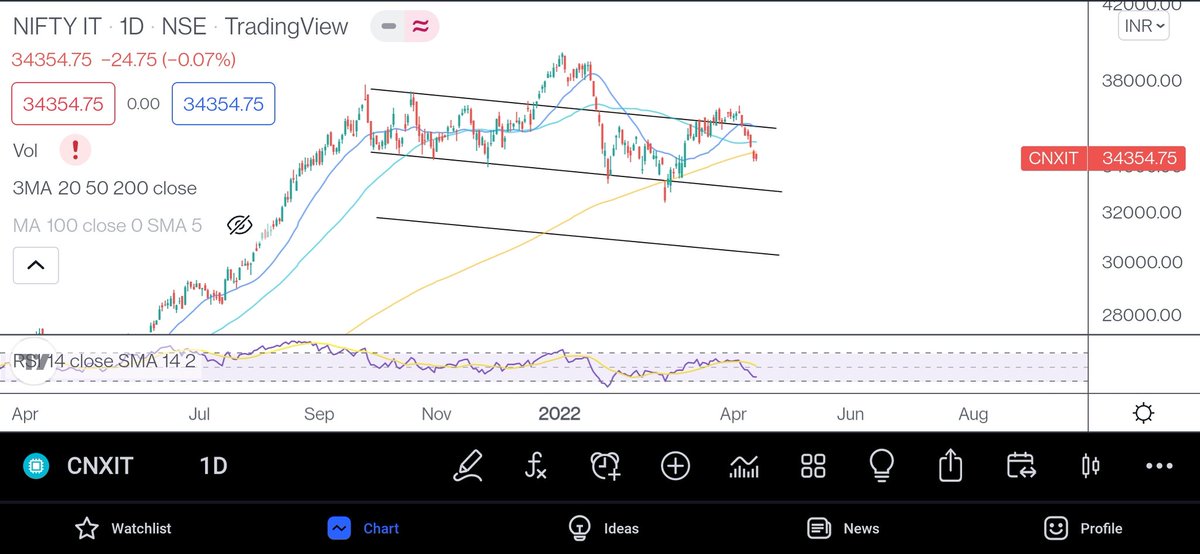
#CNXIT https://t.co/w3qedea7T6
Almost there. Quick move. It can spend time over here before the next leg of fall. Let's see.#NIFTYIT https://t.co/GOB28HRvMp pic.twitter.com/6sNc7j8gEU
— Aakash Gangwar (@akashgngwr823) March 9, 2022
Won't be surprised to see 300 in KPIT this year.
#KPITTECH https://t.co/qPLH3li2Yy
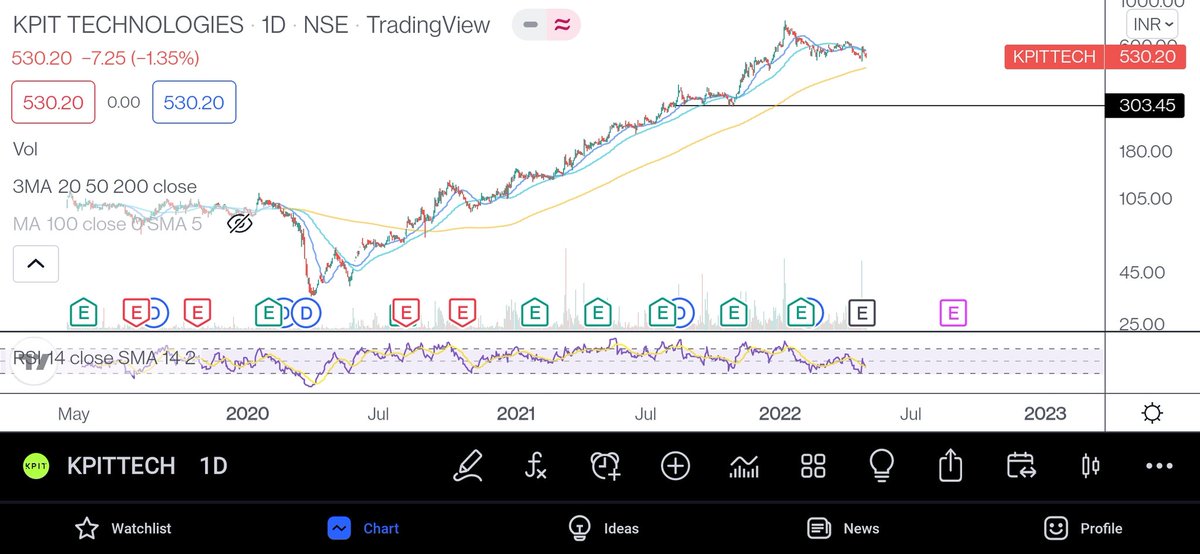
#KPITTECH https://t.co/qPLH3li2Yy
Charts for reference. During a downtrend, news based buying is an opportunity to make an exit in most of the cases. #KPITTECH #Hikal https://t.co/63WBMFZ6BT pic.twitter.com/OgWzulTXiD
— Aakash Gangwar (@akashgngwr823) April 27, 2022