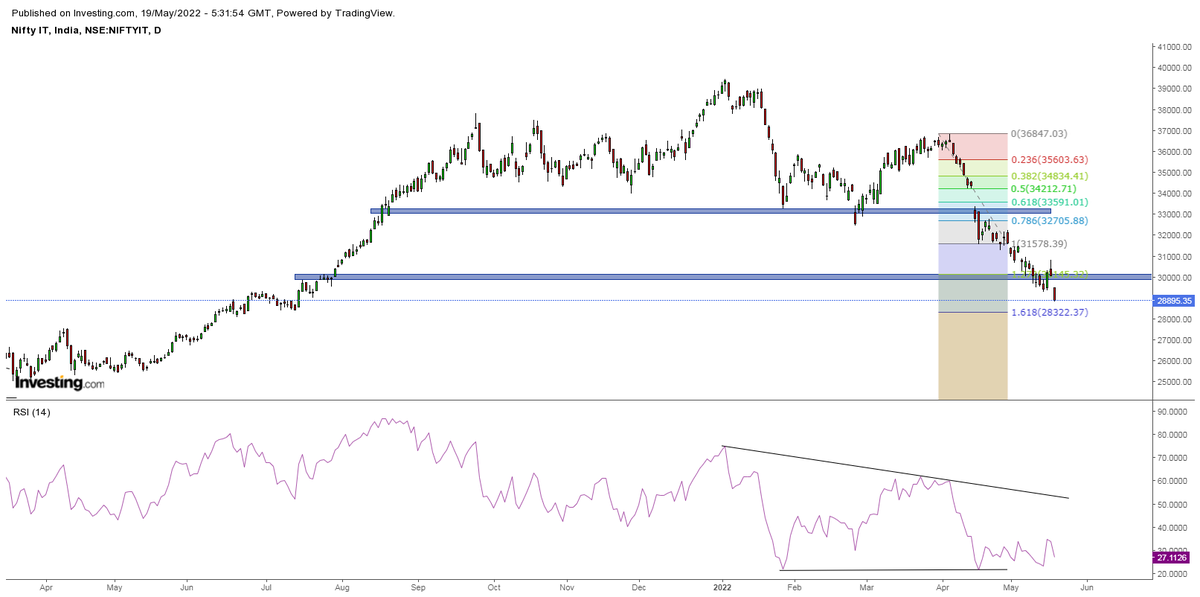
#CNXIT
Weekly chart.
Each Fibonacci retracement level shown in #box likely to be tested in time to come.
#Perspective https://t.co/aDDZJV2KE3

#CNXIT-36442#NiFTY IT
— Waves_Perception(Dinesh Patel) \u092e\u0948\u0902Schedule Tribe) (@idineshptl) March 25, 2022
Weekly chart.
Objective is to creat lower top against ATH.(39446.70)
MACD showing negative divergence. Attract selling pressure in time to come.#Probability pic.twitter.com/hPx8SMpeoo
More from Waves_Perception(Dinesh Patel) मैंSchedule Tribe)

More from Cnxitlongterm

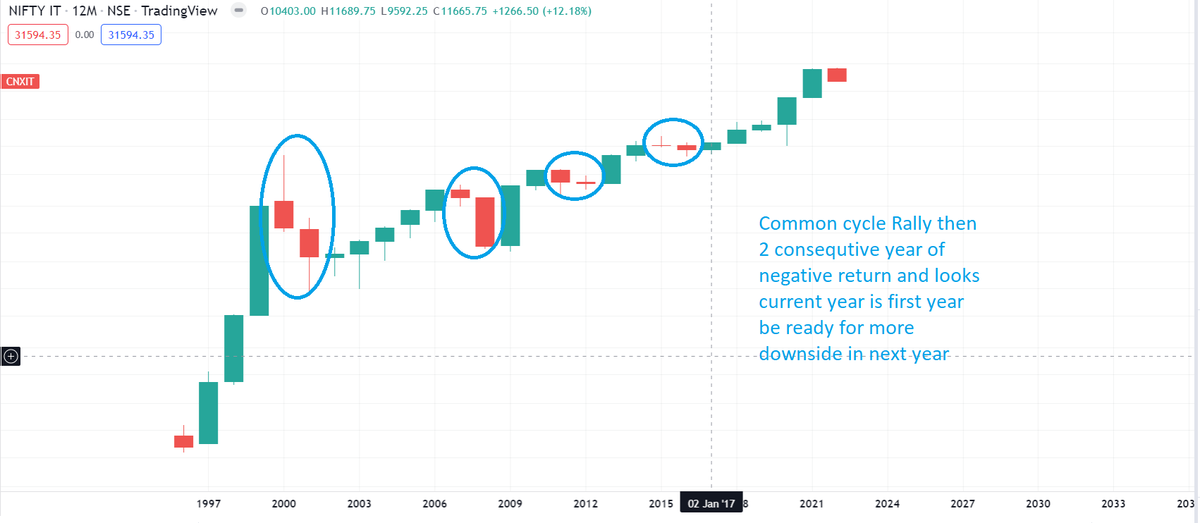

We often hear that prediction in markets is a nasty game, but we don't really have to believe everything we read on social media. Do we? As long as you maintain good accuracy in your predictions, you will do absolutely great.
#CNXIT https://t.co/w3qedea7T6
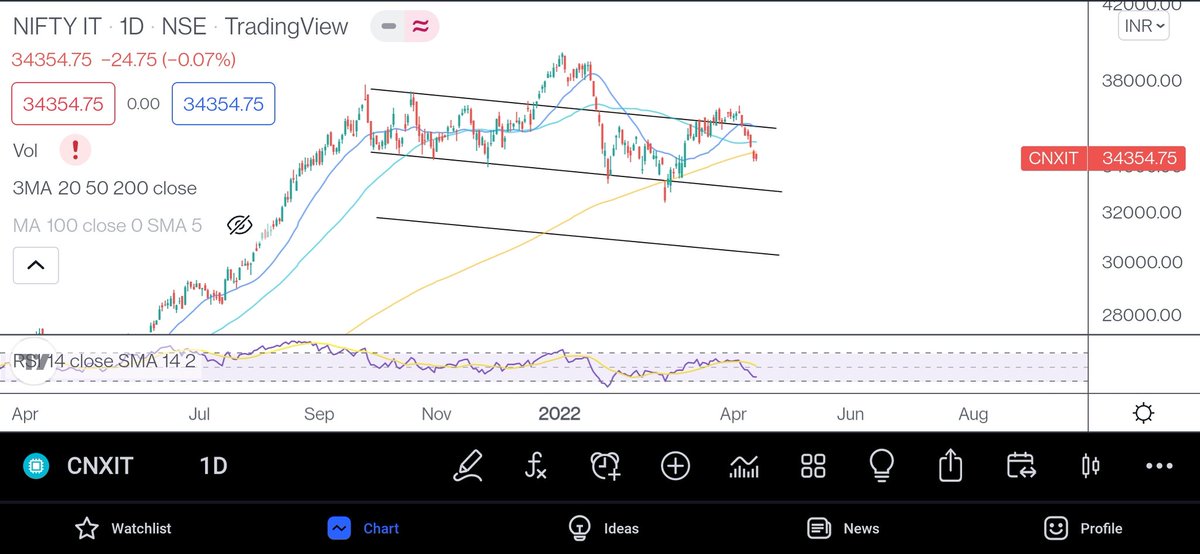
#CNXIT https://t.co/w3qedea7T6
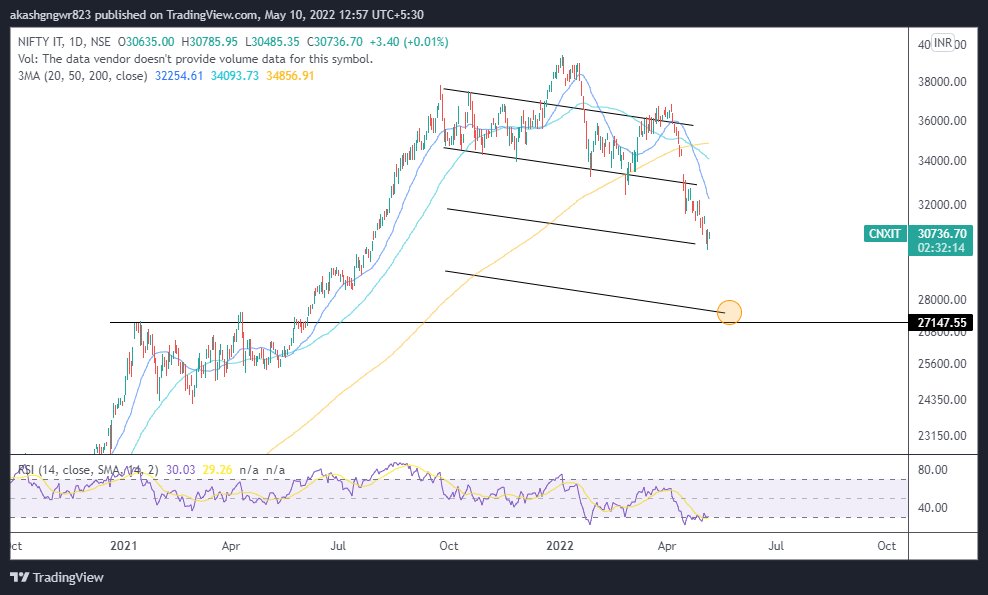
Almost there. Quick move. It can spend time over here before the next leg of fall. Let's see.#NIFTYIT https://t.co/GOB28HRvMp pic.twitter.com/6sNc7j8gEU
— Aakash Gangwar (@akashgngwr823) March 9, 2022


You May Also Like

1/“What would need to be true for you to….X”
Why is this the most powerful question you can ask when attempting to reach an agreement with another human being or organization?
A thread, co-written by @deanmbrody:
2/ First, “X” could be lots of things. Examples: What would need to be true for you to
- “Feel it's in our best interest for me to be CMO"
- “Feel that we’re in a good place as a company”
- “Feel that we’re on the same page”
- “Feel that we both got what we wanted from this deal
3/ Normally, we aren’t that direct. Example from startup/VC land:
Founders leave VC meetings thinking that every VC will invest, but they rarely do.
Worse over, the founders don’t know what they need to do in order to be fundable.
4/ So why should you ask the magic Q?
To get clarity.
You want to know where you stand, and what it takes to get what you want in a way that also gets them what they want.
It also holds them (mentally) accountable once the thing they need becomes true.
5/ Staying in the context of soliciting investors, the question is “what would need to be true for you to want to invest (or partner with us on this journey, etc)?”
Multiple responses to this question are likely to deliver a positive result.
Why is this the most powerful question you can ask when attempting to reach an agreement with another human being or organization?
A thread, co-written by @deanmbrody:
Next level tactic when closing a sale, candidate, or investment:
— Erik Torenberg (@eriktorenberg) February 27, 2018
Ask: \u201cWhat needs to be true for you to be all in?\u201d
You'll usually get an explicit answer that you might not get otherwise. It also holds them accountable once the thing they need becomes true.
2/ First, “X” could be lots of things. Examples: What would need to be true for you to
- “Feel it's in our best interest for me to be CMO"
- “Feel that we’re in a good place as a company”
- “Feel that we’re on the same page”
- “Feel that we both got what we wanted from this deal
3/ Normally, we aren’t that direct. Example from startup/VC land:
Founders leave VC meetings thinking that every VC will invest, but they rarely do.
Worse over, the founders don’t know what they need to do in order to be fundable.
4/ So why should you ask the magic Q?
To get clarity.
You want to know where you stand, and what it takes to get what you want in a way that also gets them what they want.
It also holds them (mentally) accountable once the thing they need becomes true.
5/ Staying in the context of soliciting investors, the question is “what would need to be true for you to want to invest (or partner with us on this journey, etc)?”
Multiple responses to this question are likely to deliver a positive result.