Horizontal line is the resistance, trendline indicates higher lows, i.e. uptrend.
It is a bullish pattern.


Trading on chart patterns is difficult until you read this !\u26a1\ufe0f
— The Chartians (@chartians) August 28, 2022
Everything about Ascending Triangle Pattern
Free Technical Analysis course (3/10) \U0001f9f5
Glad that many could guess/ know the candle stick pattern and mainly know how to use it.
— The Chartians (@chartians) July 24, 2021
The one shown in the image was bullish Harami
The word Harami comes from an old Japanese word meaning pregnant.. pic.twitter.com/4qBDCyY2Pq
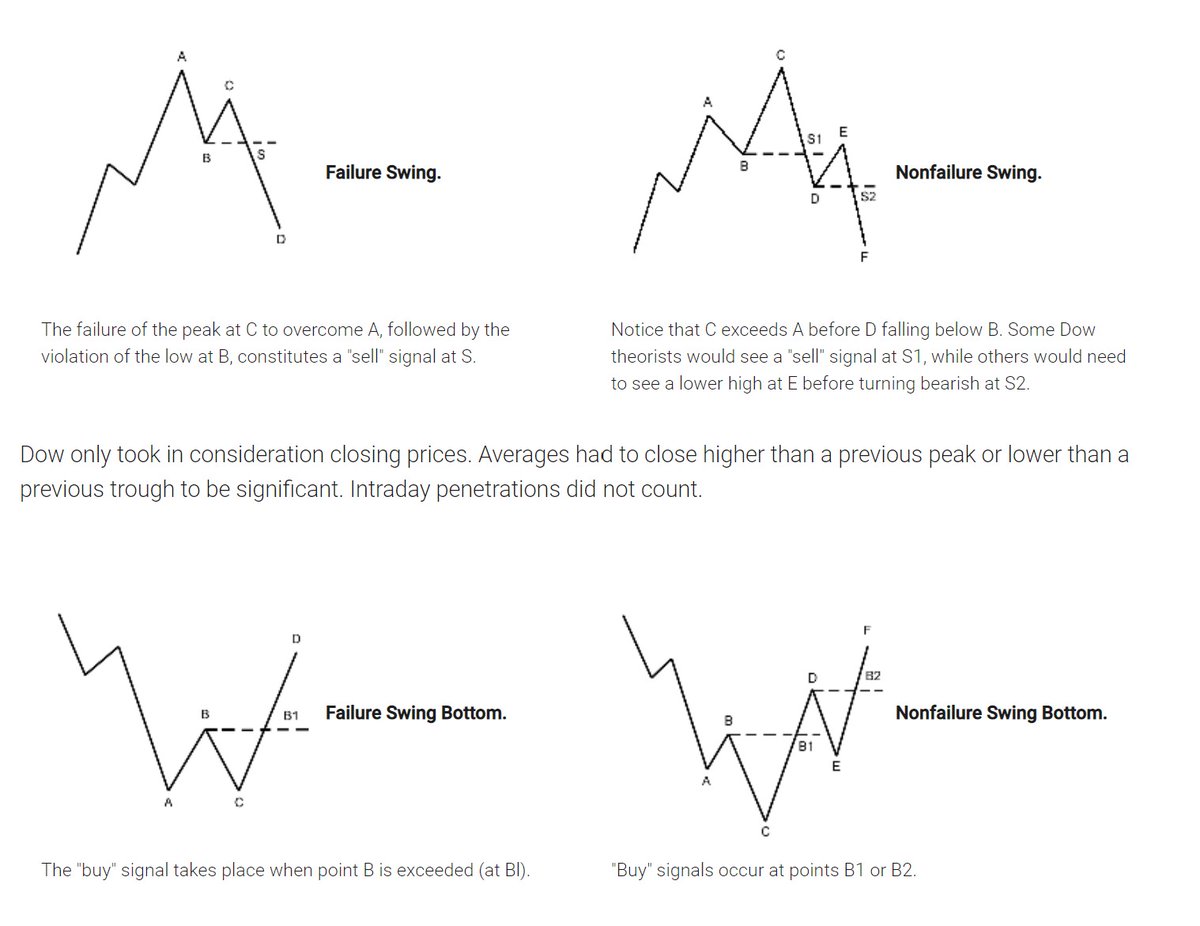
Old is Gold....
— Professor (@DillikiBiili) January 23, 2020
this Bharti Airtel chart is a true copy of the Wyckoff Pattern propounded in 1931....... pic.twitter.com/tQ1PNebq7d