How to Draw
Support , Resistance and Trendlines ?
A Foundation of Stock Market !
A Thread 🧵
Retweet and Share :)
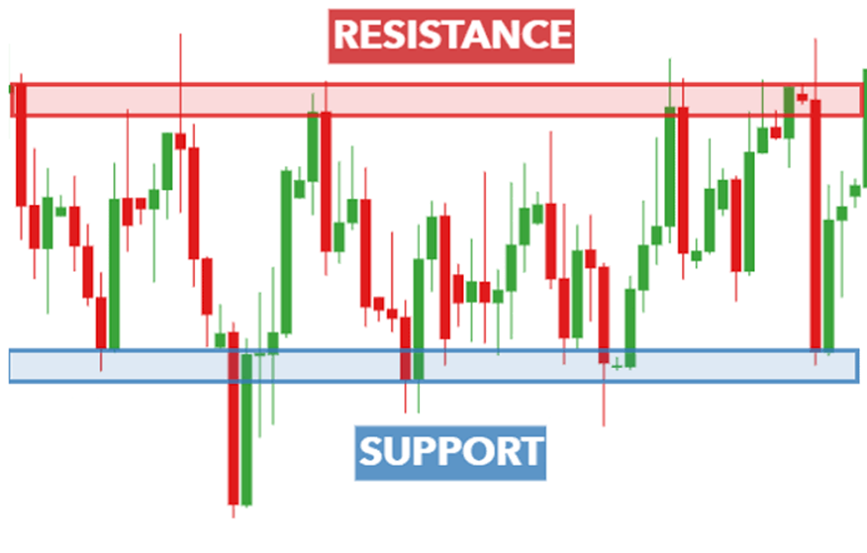
What is Support and Resistance ?
⏫Support is an area for price , where it halts due to demand of the stock at that price .
⏬Resistance is an area for price ,where it halts due to Supply of the stock at that price .
1/n
How to Draw S/R ?
You can use Any time frame for Drawing S/R and it works on all time frames .
Whenever the Price Reverses from an area for more than 2 times that area can be called as S/R .
You can use Line Tool Or Rectangle tool to plot this on charts .
2/n
Types of Support Resistance
1. Horizontal
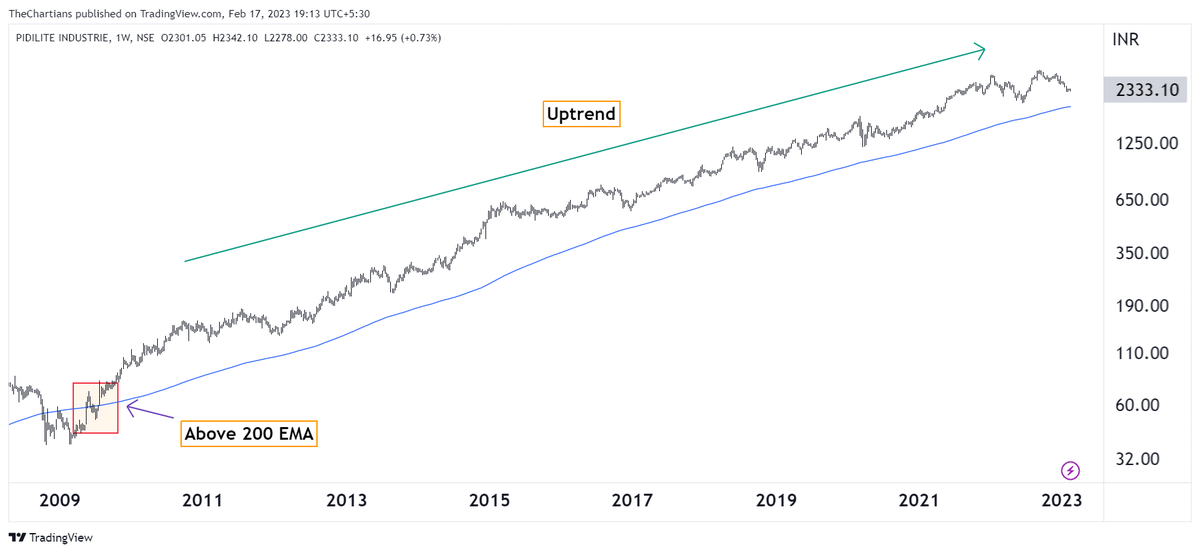
2. Moving Averages
3. Trendline
4. Psychological Numbers (100 , 200 etc)
3/n
Reversal of Polarity .
Whenever Resistance Breaks , it tends to act as support and Whenever support breaks it tends to act as resistance
4/n