THE SCIENCE BEHIND YAJNA
Fire is, of course, one of the greatest discovery of mankind. Our control over the fire dramatically changed the entire human habits; earlier it was used to cook food, protection from animals and to stay warm.
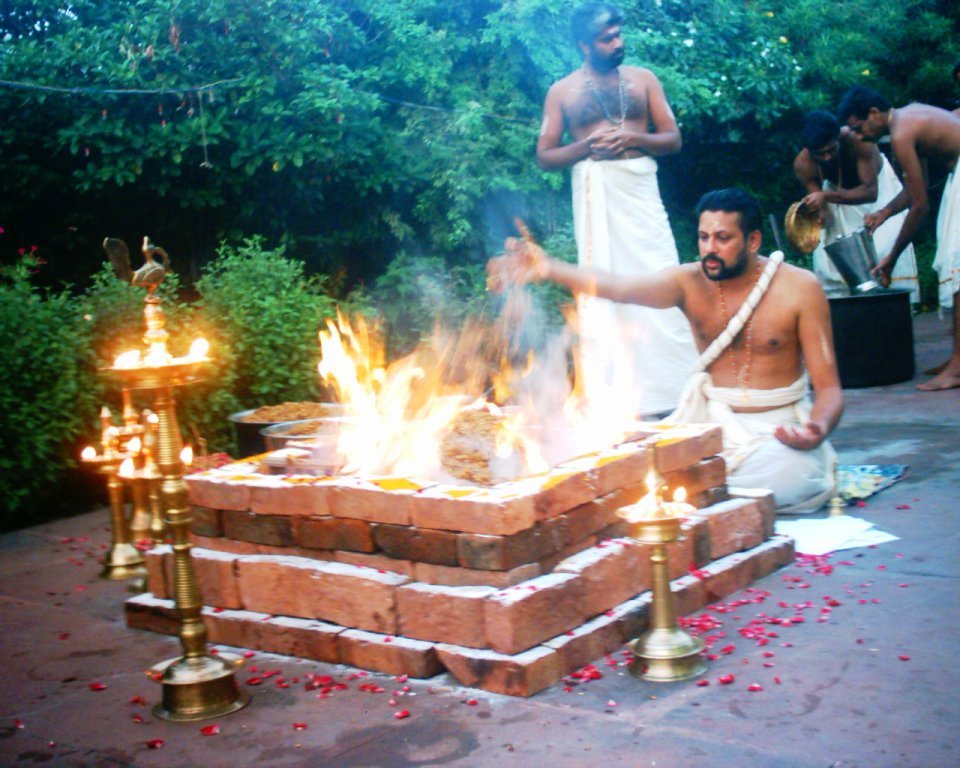
Among the many applications of fire, one is Yajna (यज्ञ, yajña); also called as Havana (हवन) or Agnihotra (अग्निहोत्र).
Yajna is elaborately described in Yajurveda. In Yajurveda, Yajna is the greatest among all works (Karman). One can purify his /her soul by performing Yajna.
In Vedic culture, it is thought that the holy fire is the mediator between Gods and us; when the offerings are made to Yajna with chanting mantras, it directly reaches the Gods, who bless the people with rains, food, health, and good luck.
According to Apastamba Sutra, the definition of Yajna is Vedic sacrifice; an act by which we surrender something for gods e.g. grains (Anna), pulse, milk and milk product (ghee, butter, curd) fruits, plant juice (soma), etc.
As we said; Yajna is the contact medium for gods and
to seek their blessings.
There are many types of Yajna performed by Hindus for e.g.,
1. Rajsuya Yajna
2. Ashwamedha Yajna
3. Chaaturmasya Yajna
4. Vaajpey Yajna
5. Purushmedha Yajna
6. Sarvamedha Yajna