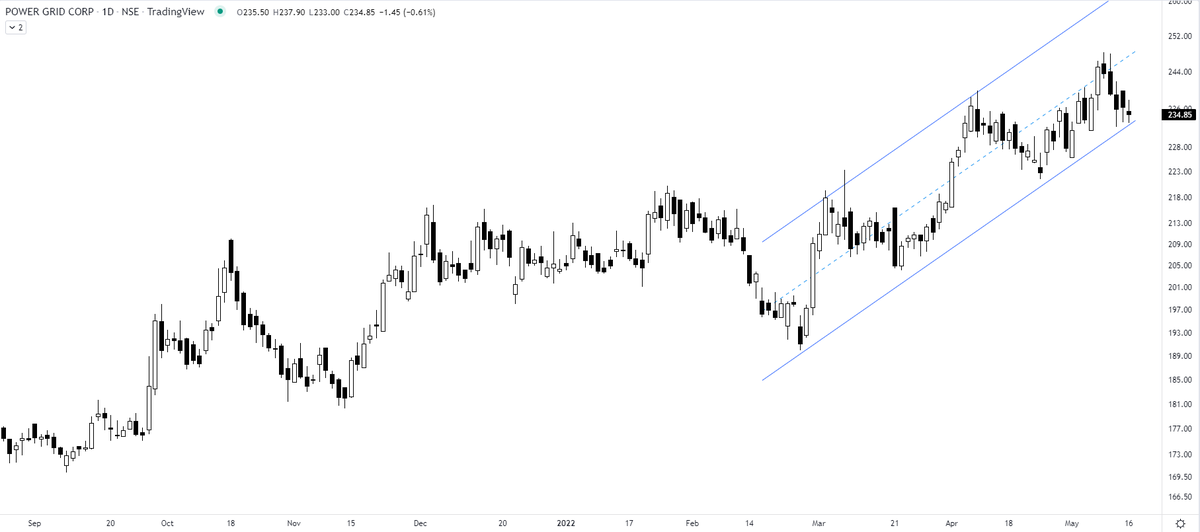
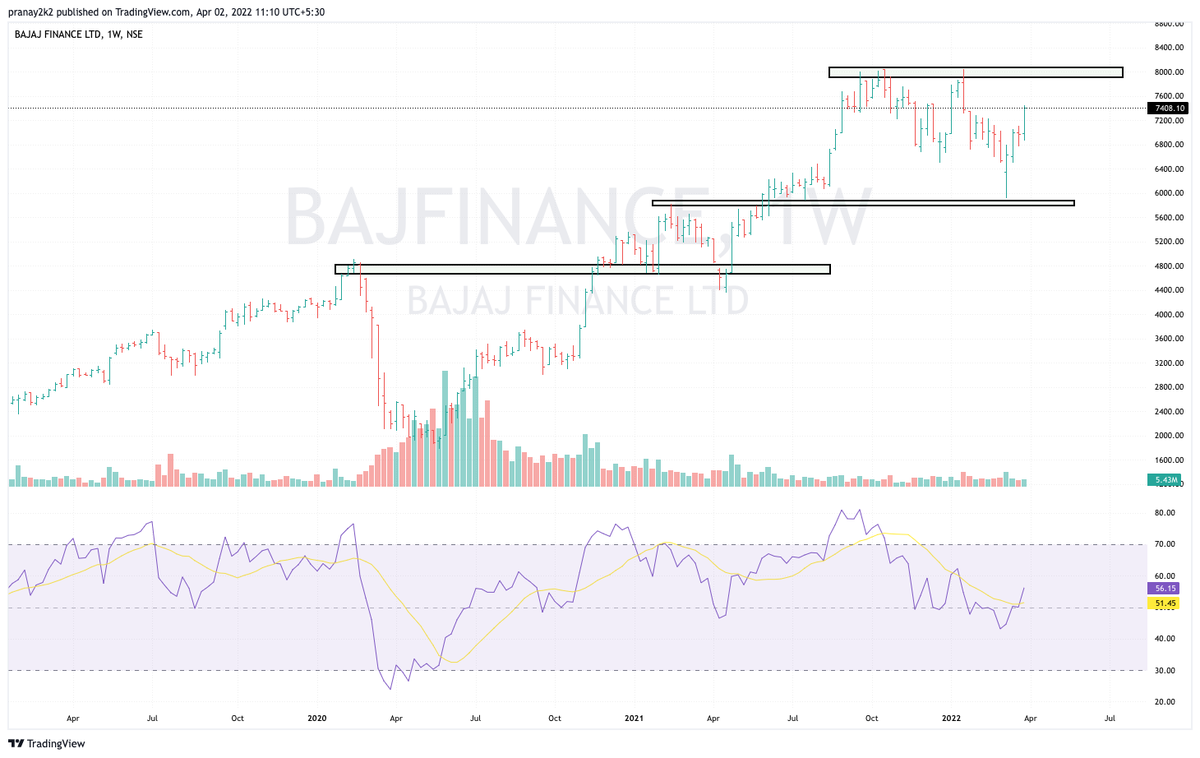
The chart pattern working on a larger timeframe gives a broad perspective on the direction of the security and is easy to trade once you get a breakout. the easy way is to set the price alert & make money elsewhere.
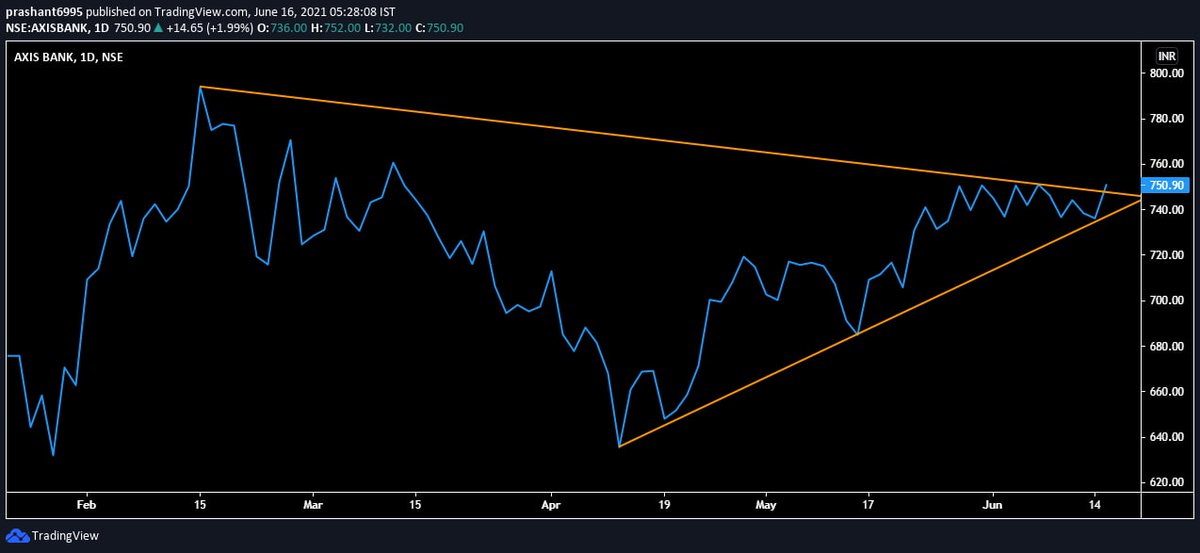
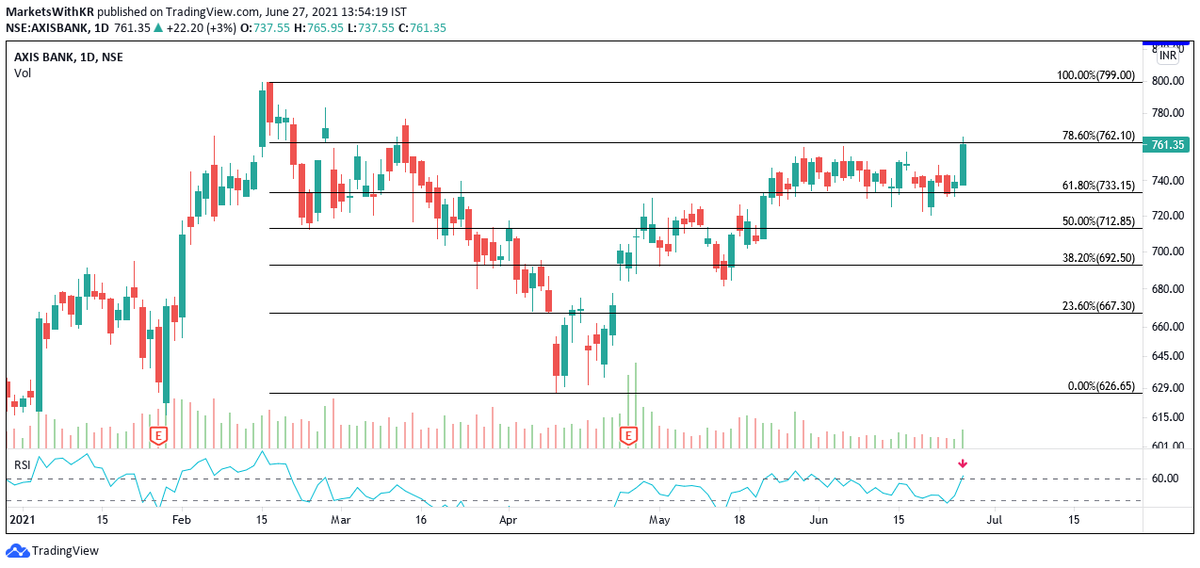
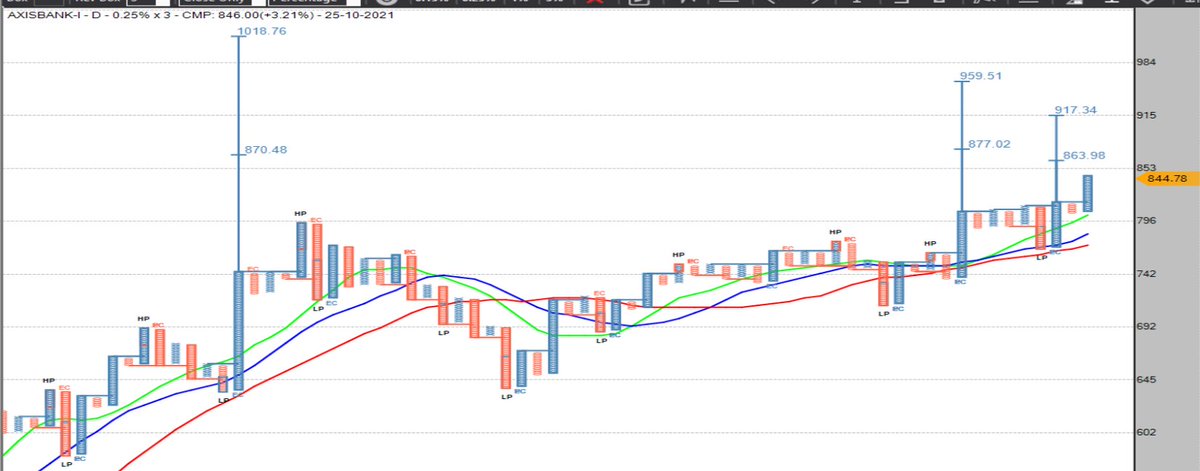
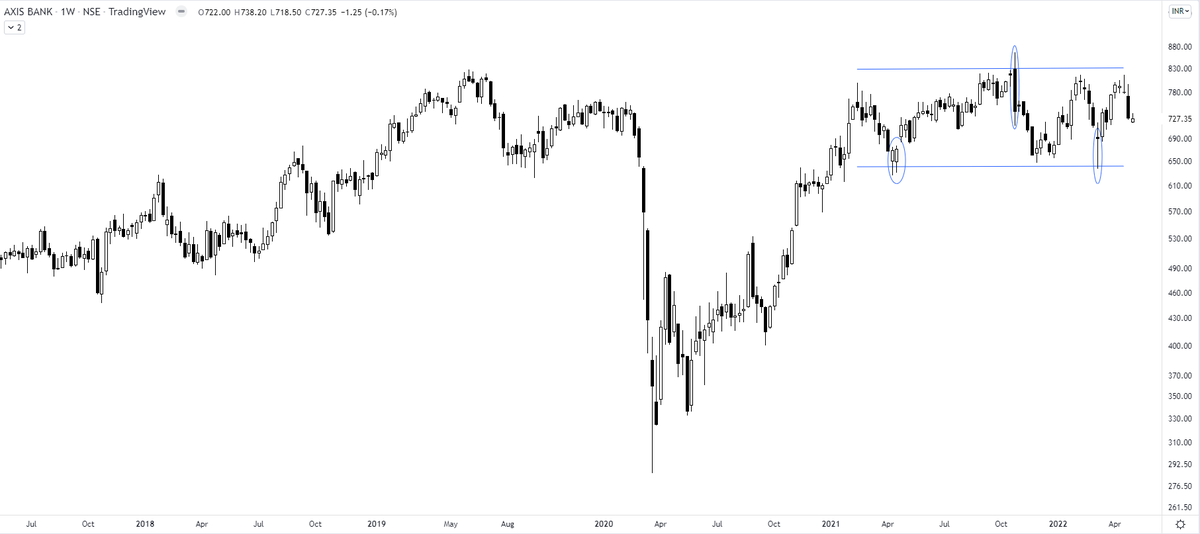
Axis Bank
More from The_Chartist 📈

IEX Indian Energy Exchange - ⭕️⭕️
although a must-have portfolio stock. Faced resistance right at the upper channel boundary. Volumes high. Any retracement back to the lower boundary will be an opportunity to accumulate. https://t.co/5uDsUXsbPP
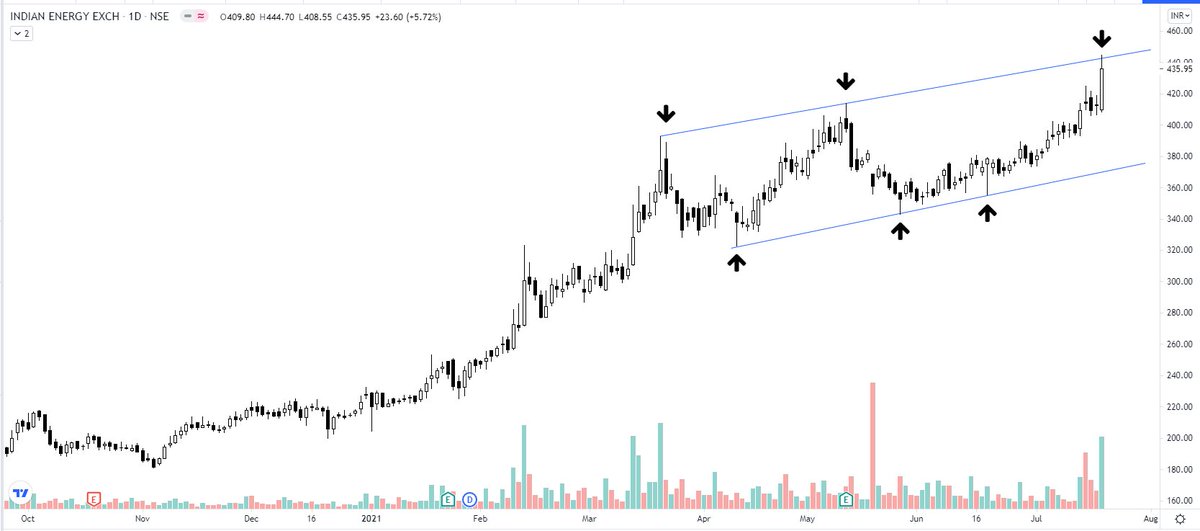
although a must-have portfolio stock. Faced resistance right at the upper channel boundary. Volumes high. Any retracement back to the lower boundary will be an opportunity to accumulate. https://t.co/5uDsUXsbPP
IEX - the resistance turning support. Kindly review, please. @nishkumar1977 @suru27 @rohanshah619 @indian_stockss @sanstocktrader @BissaGauravB @RajarshitaS @PAVLeader @Rishikesh_ADX @VijayThk @Investor_Mohit @TrendTrader85 pic.twitter.com/7CCzmee5If
— Steve Nison (@nison_steve) December 18, 2020