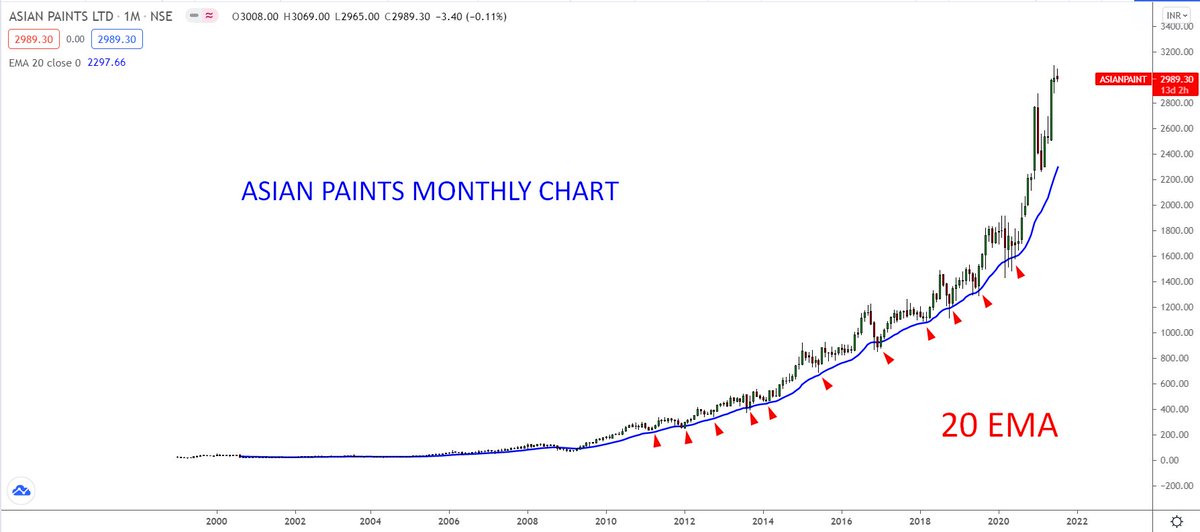
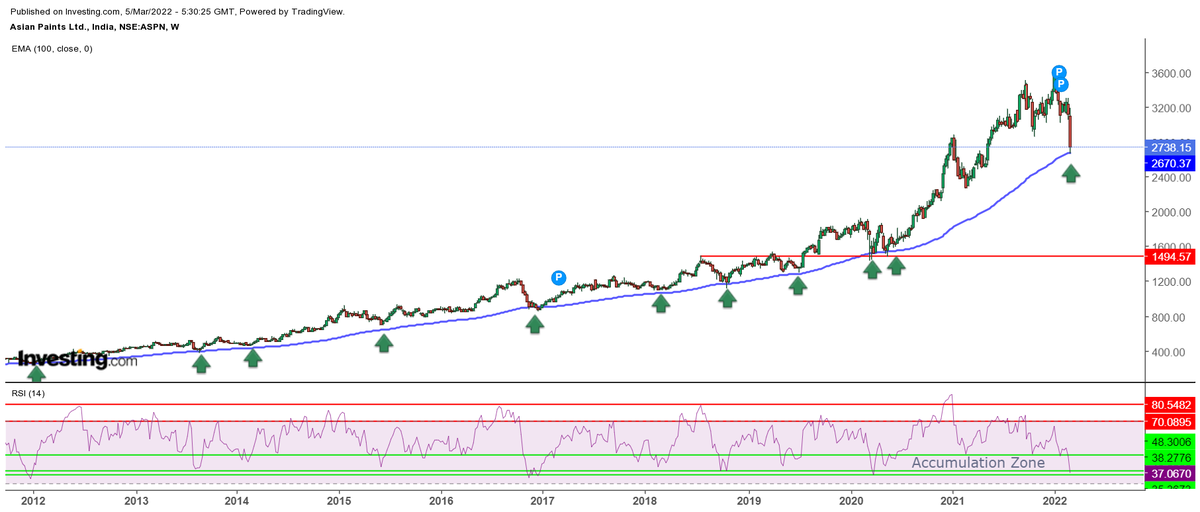
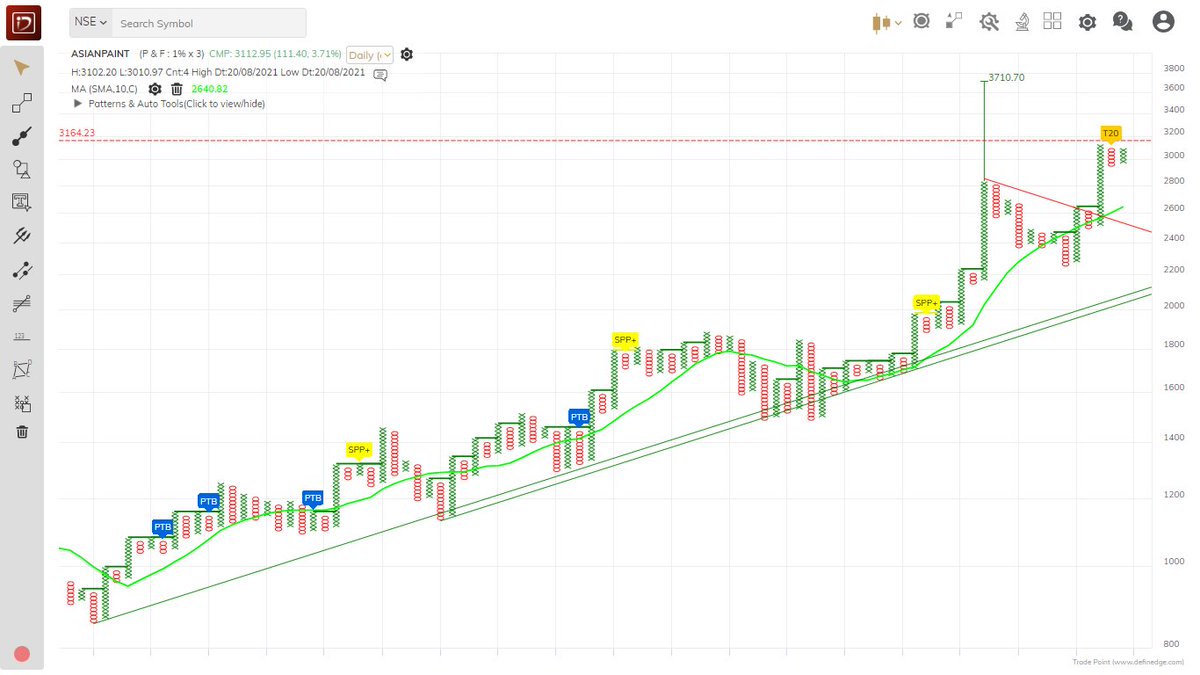
Asian Paints: pehle upar H&S ab neeche Inverted H&S....

More from Professor
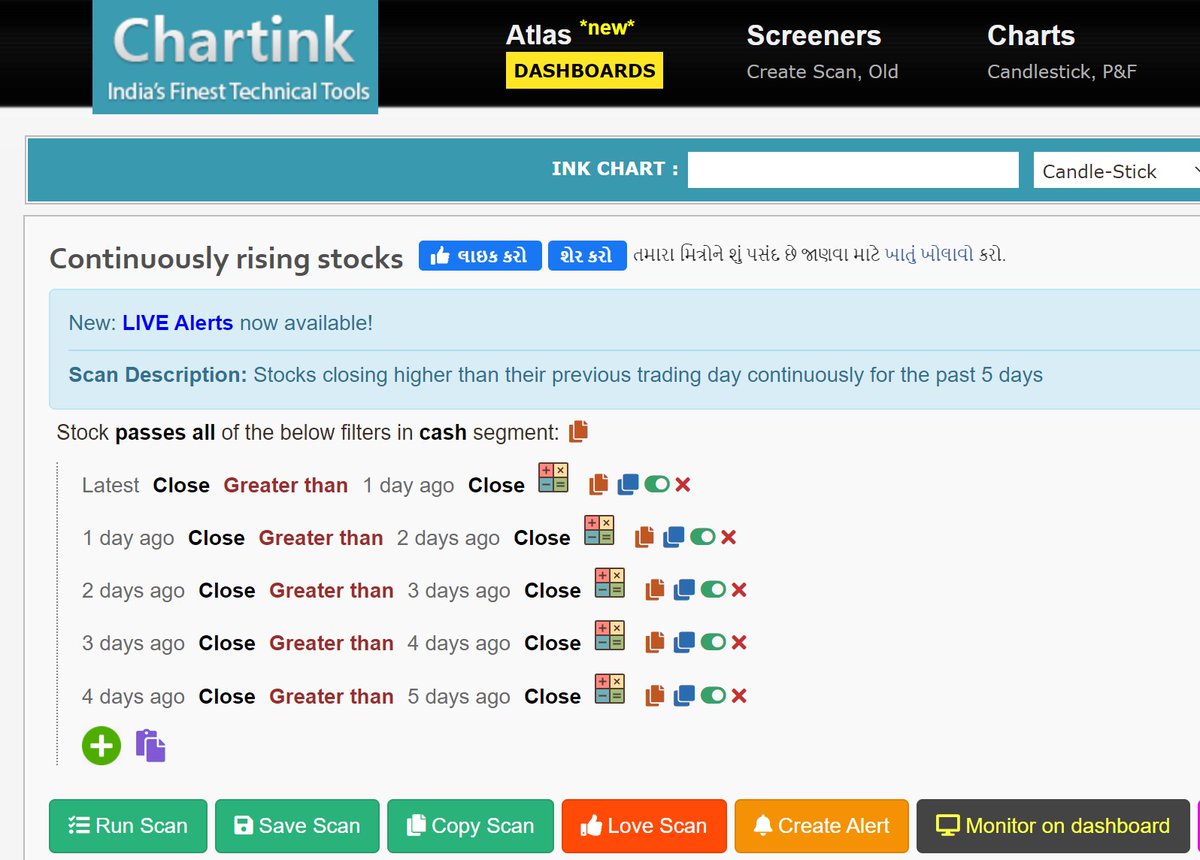
For finding potential breakout candidates, you may run this scanner daily EOD, whenever any new candidate props up, check its chart for signs of breakout.
You may modify & fine tune this as per your own criteria like adding RSI or ADX or other indicators. https://t.co/FdiPG1c4s0
You may modify & fine tune this as per your own criteria like adding RSI or ADX or other indicators. https://t.co/FdiPG1c4s0
Bhai, can you please educate us, how do you find the breakout stocks? I mean which scanner? Any inputs would be much helpful.
— Loyalty Respect (@Novicetrader99) October 1, 2021


OI Data reading seekh lo:
See Large OIl buildup kin strikes par hai and in between strikes data kaise move ho raha hai.
Thumb Rule:
Calls Reduction + Puts addition = Upthrust
Calls Addition + Put Reduction = Down move
Higher the Delta OI velocity, faster is the move.
See Large OIl buildup kin strikes par hai and in between strikes data kaise move ho raha hai.
Thumb Rule:
Calls Reduction + Puts addition = Upthrust
Calls Addition + Put Reduction = Down move
Higher the Delta OI velocity, faster is the move.
For Nifty Intraday Traders: As of now, this seems to be a buy on dip market and looks like there won't be any juicy trades on short side. Will update if data changes. https://t.co/PCIyyPld4A pic.twitter.com/ES3o4z60rY
— Professor (@DillikiBiili) March 11, 2022