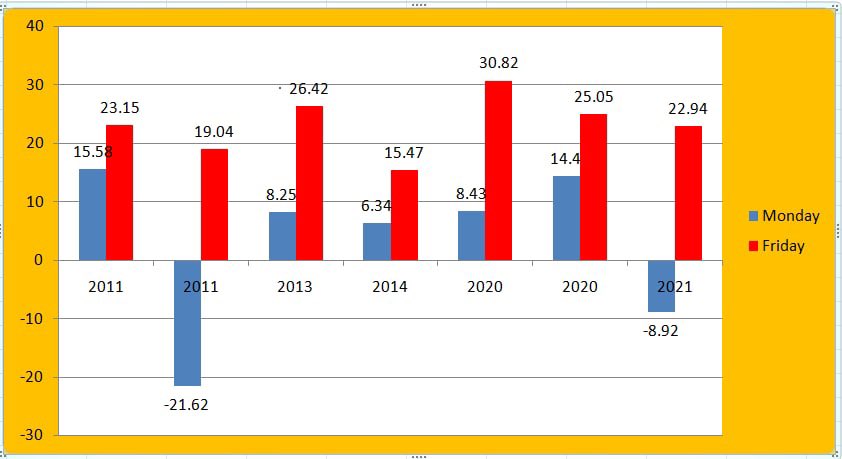
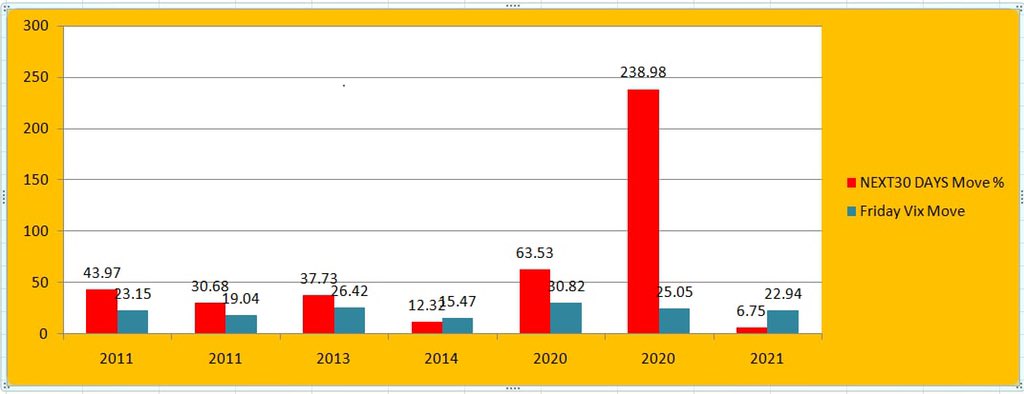
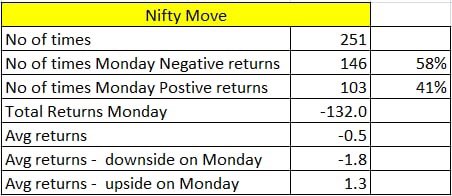
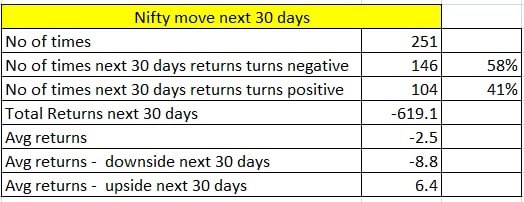
Whenever #Nifty & #BankNifty closes less than -1% on Fridays, what happens on Monday and what happens on next 30 days. Interesting analysis, will be sharing the details shortly.

More from Kirubakaran Rajendran


I have shared multiple information related to trading and investing through my historical data analysis by writing various articles, here's the master thread that contains all my work in one place.🧵
https://t.co/pc1jr1xBlI
https://t.co/KZJ1FKCXSp
https://t.co/pTnbkjVpr0
https://t.co/3QXmND1x6Y
https://t.co/pc1jr1xBlI
Am sharing my journey on how I started trading 15 years before when there was very limited resource. If you are a beginner who is looking to get started with Stock Market, this thread would be helpful.\U0001f9f5
— Kirubakaran Rajendran (@kirubaakaran) April 26, 2022
https://t.co/KZJ1FKCXSp
Many of my friends who work at Corporate culture are fed up with their work life, one question they keep asking me is how much money do I need to retire and live comfortably? Here\u2019s a short thread \U0001f9f5 pic.twitter.com/gNEOFOChlh
— Kirubakaran Rajendran (@kirubaakaran) May 24, 2022
https://t.co/pTnbkjVpr0
Year 2022 has been disastrous for many asset classes, the world economy is at 40 year high inflation. Are we headed for another stock market crash? Here's a detailed analysis. \U0001f9f5 pic.twitter.com/ZYch9yBHEq
— Kirubakaran Rajendran (@kirubaakaran) May 19, 2022
https://t.co/3QXmND1x6Y
I have closely observed FinNifty for couple of weeks and then started trading live since last 4 expiry. If you are looking to start trading with FinNifty weekly option then this thread might be of great help to you. \U0001f9f5
— Kirubakaran Rajendran (@kirubaakaran) July 12, 2022
Most beginners when building a trading strategy simply use current info and test with it, they don't know How to Get Historical Stock Futures lot size, list of stocks that are part of index like Nifty 50, Nifty 500 historically, I will share all such info in this thread
Please note that there is no way to get the historical lot size of stocks futures, NSE don't publish it directly, so we need to do some calculated steps to get that data. Download Market Activity report https://t.co/HKLkSVtXEI
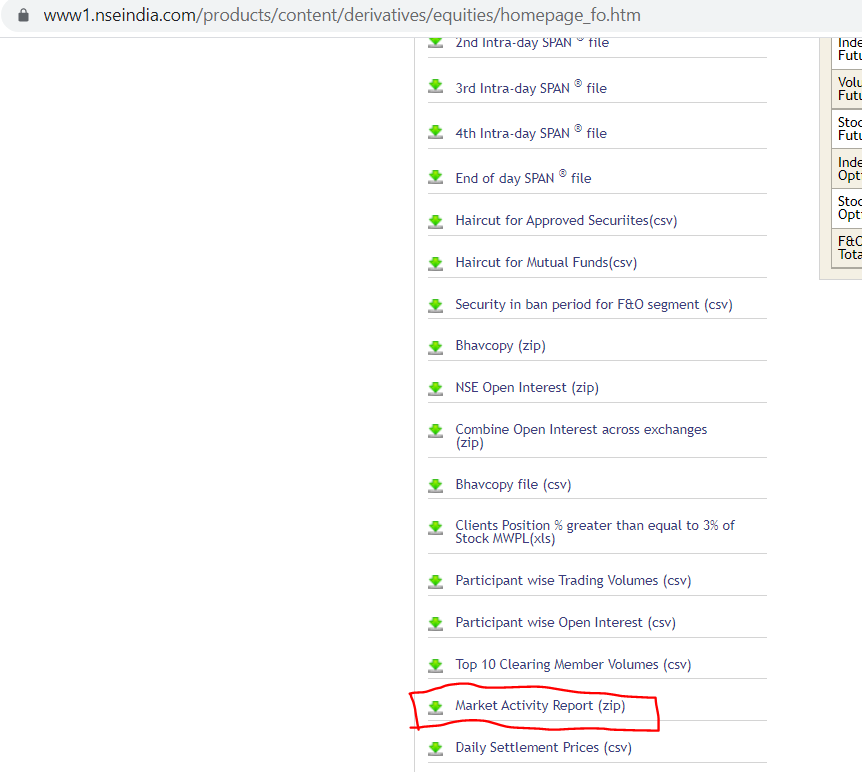
The zip file contains multiple files, open the second file.
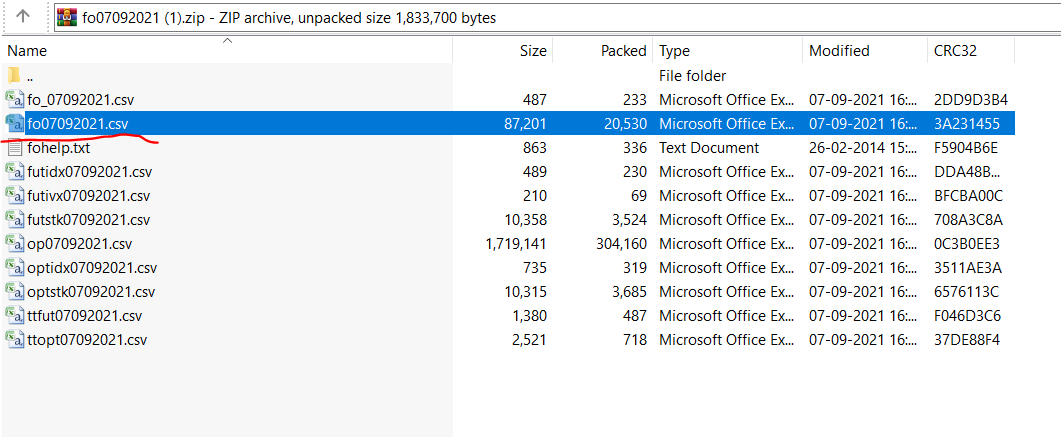
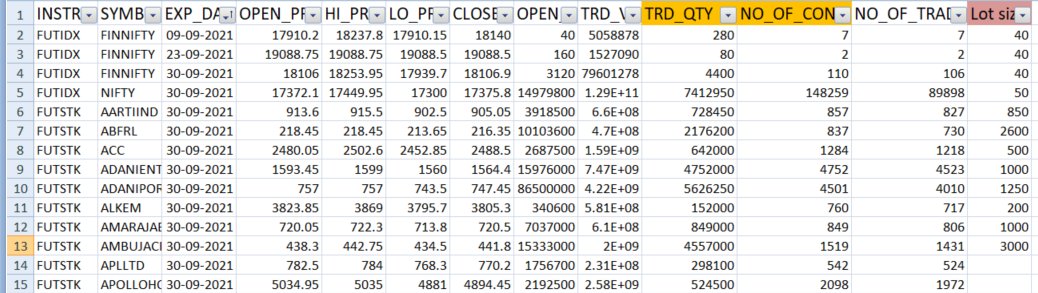
The file will contain stock symbol, expiry date, OHLC data, along with that you get traded quantity and No of contracts traded, using this data we can calculate the lot size of every stock symbol. Simply divide Traded QTY / NO of contracts gives you the lot size.
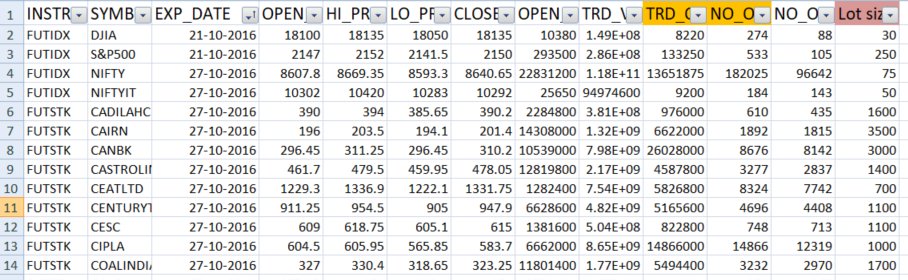
So to get the historical stock futures data, all you need to do is change the date in the below link
https://t.co/xIBXsPpIVt For an example, to get the historical stock futures lot size data for Sep 2016, use https://t.co/Criu7S3Fi5
Please note that there is no way to get the historical lot size of stocks futures, NSE don't publish it directly, so we need to do some calculated steps to get that data. Download Market Activity report https://t.co/HKLkSVtXEI
The zip file contains multiple files, open the second file.
The file will contain stock symbol, expiry date, OHLC data, along with that you get traded quantity and No of contracts traded, using this data we can calculate the lot size of every stock symbol. Simply divide Traded QTY / NO of contracts gives you the lot size.
So to get the historical stock futures data, all you need to do is change the date in the below link
https://t.co/xIBXsPpIVt For an example, to get the historical stock futures lot size data for Sep 2016, use https://t.co/Criu7S3Fi5
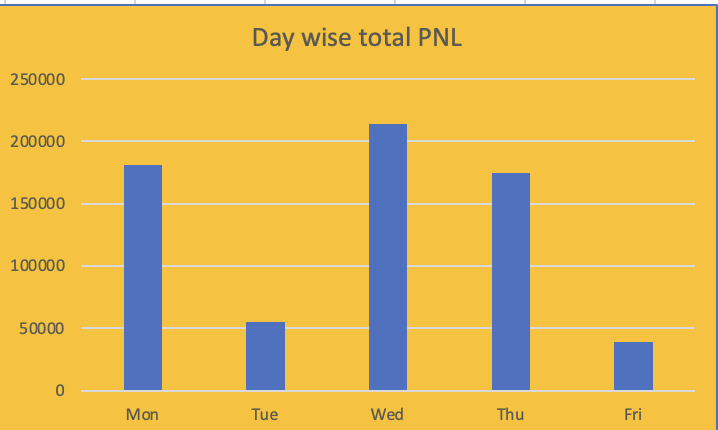
Here's a detailed analysis of 920 Straddle with 25% SL using @stockmock_in platform. This analysis would show which days are max profitable, how it behaves on gap days and how it behaves on different VIX days. 🧵
Here's day wise total profits, Wednesday are the days it has generated highest profits compared to all other days and Friday being the least profitable day.
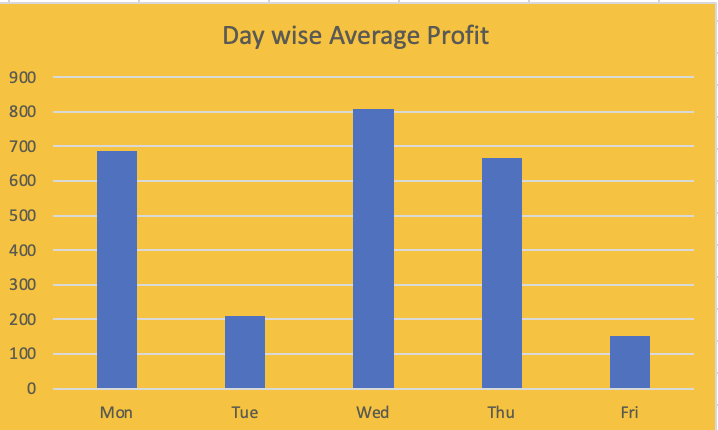
Here's day wise average profits, obviously Wednesday are the days it has generated highest average profits compared to all other days and Friday being the least profitable day.
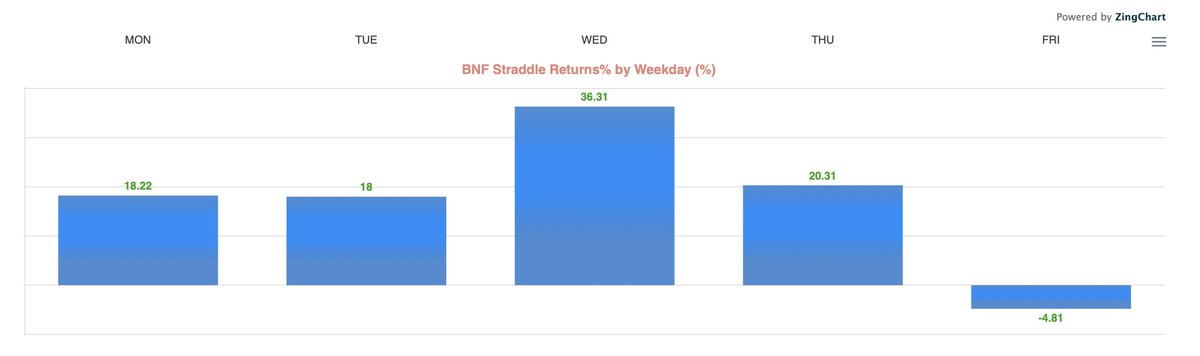
Even the live profits after all charges generated through 920 straddle trading bots at https://t.co/AKj4vqky6X also reflected Fridays are not profitable when you incur all charges. Wednesday being the most profitable day. Live profits are shown here https://t.co/3hgti23lRB
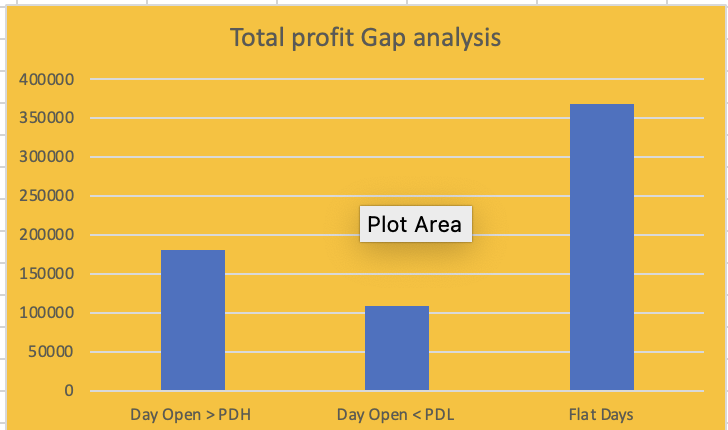
Here's total profits made during gaps, when day open is greater than previous day high, Day open < Prev day low and flat days. Irrespective of gaps, its able to generate profits over all. Even the avg profits denotes the same
Here's day wise total profits, Wednesday are the days it has generated highest profits compared to all other days and Friday being the least profitable day.
Here's day wise average profits, obviously Wednesday are the days it has generated highest average profits compared to all other days and Friday being the least profitable day.
Even the live profits after all charges generated through 920 straddle trading bots at https://t.co/AKj4vqky6X also reflected Fridays are not profitable when you incur all charges. Wednesday being the most profitable day. Live profits are shown here https://t.co/3hgti23lRB
Here's total profits made during gaps, when day open is greater than previous day high, Day open < Prev day low and flat days. Irrespective of gaps, its able to generate profits over all. Even the avg profits denotes the same
If you are someone who spends more time on analyzing markets during trading, then this for you. Certain traders will create their own bullish or bearish view in their mind but seek confirmation for their trades which is called as confirmation bias. #tradingpsychology 1/15
We do not like people or information that contradicts our thoughts. We like them when they confirm what we think. Hence, we tend to place more weight on information that confirms our trade position. Example- You think market is bullish & wanted to go on a long position,
Next a new bullish bar prints on the chart. You would think "Yes, my bullish proposition is still valid" (even though this bullish bar is smaller range)
A bearish bar prints. But you think "this bar lacks momentum" (because you already have firm belief that market is bullish)
One more bearish bar follows, pushing against a support level. But you would think "the support level is holding" Bullishness confirmed. Buy more! (even though this bar closed below the support level with clear momentum.)
During Trading hours, Your maximum time is spent on? Are you spending more time on analyzing your trades before placing the order or after placing the order?
— Kirubakaran Rajendran (@kirubaakaran) December 14, 2020
We do not like people or information that contradicts our thoughts. We like them when they confirm what we think. Hence, we tend to place more weight on information that confirms our trade position. Example- You think market is bullish & wanted to go on a long position,
Next a new bullish bar prints on the chart. You would think "Yes, my bullish proposition is still valid" (even though this bullish bar is smaller range)
A bearish bar prints. But you think "this bar lacks momentum" (because you already have firm belief that market is bullish)
One more bearish bar follows, pushing against a support level. But you would think "the support level is holding" Bullishness confirmed. Buy more! (even though this bar closed below the support level with clear momentum.)
You May Also Like


This is NONSENSE. The people who take photos with their books on instagram are known to be voracious readers who graciously take time to review books and recommend them to their followers. Part of their medium is to take elaborate, beautiful photos of books. Die mad, Guardian.
THEY DO READ THEM, YOU JUDGY, RACOON-PICKED TRASH BIN

If you come for Bookstagram, i will fight you.
In appreciation, here are some of my favourite bookstagrams of my books: (photos by lit_nerd37, mybookacademy, bookswrotemystory, and scorpio_books)

Beautifully read: why bookselfies are all over Instagram https://t.co/pBQA3JY0xm
— Guardian Books (@GuardianBooks) October 30, 2018
THEY DO READ THEM, YOU JUDGY, RACOON-PICKED TRASH BIN
If you come for Bookstagram, i will fight you.
In appreciation, here are some of my favourite bookstagrams of my books: (photos by lit_nerd37, mybookacademy, bookswrotemystory, and scorpio_books)