All Threads


Hit the 're-tweet' and help us educated more investors
Yes Bank’s additional Tier 1 bonds, written off. Lakshmi Villas Banks Tier 2 bonds, written off. Understand what & why of ATI and Tier 2 bonds in this thread.
https://t.co/VBmV2dwpPn (1/n)
Yes Bank\u2019s additional Tier 1 bonds, written off. Lakshmi Villas Banks Tier 2 bonds, written off. Understand what & why of ATI and Tier 2 bonds in this thread.
— Kirtan A Shah (@KirtanShahCFP) December 4, 2020
Do \u2018re-tweet\u2019 and help us benefit more investors (1/n)
'Floating Rate Funds' - A case for debt investing in the current interest rate situation
'Floating Rate Funds' - A case for debt investing in the current interest rate situation (A Thread)
— Kirtan A Shah (@KirtanShahCFP) November 27, 2020
You should not miss this if you invest in Debt.
Do \u2018re-tweet\u2019 & help us benefit more investors (1/n)
Fixed Income investment strategies
It’s a misconception that FD, RBI Bond, PPF etc have no risk. The reason we don’t see the risk in them is because for us, risk ONLY means loss of capital.
Fixed Income investment strategies (Thread)
— Kirtan A Shah (@KirtanShahCFP) November 20, 2020
Do 're-tweet' & help us reach & benefit investors
It\u2019s a misconception that FD, RBI Bond, PPF etc have no risk. The reason we don\u2019t see the risk in them is because for us, risk ONLY means loss of capital. (1/n)
Index Funds v/s ETFs
While index funds and ETF’s look similar, there are multiple differences you need to keep in mind before investing in either of them. Let me highlight the important ones
Index Funds v/s ETFs
— Kirtan A Shah (@KirtanShahCFP) November 17, 2020
Do 're-tweet' so that we can reach a larger audience :)
(Thread)
(1) While index funds and ETF\u2019s look similar, there are multiple differences you need to keep in mind before investing in either of them. Let me highlight the important ones (1/n)


An effective price pattern defined using properties of P&F charts.
#Superpattern #Pointandfigure #Definedge
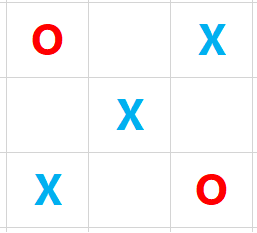
Point & Figure is an oldest charting method where price is plotted vertically, and the chart moves only when price moves. It is a different way of looking at the price, the objective box-value and reversal value offers advantage of identifying objective price patterns.
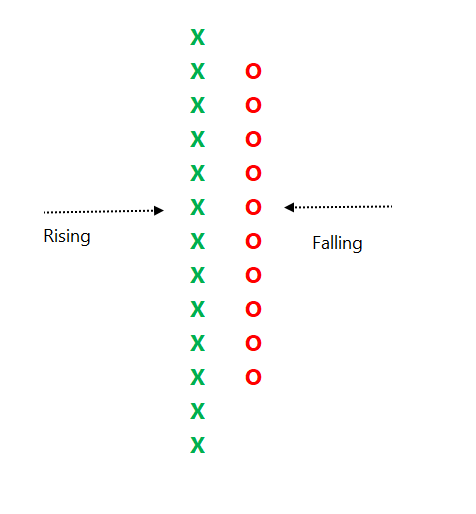
When price is moving up, it is plotted in a column of 'X'. When it is going down, it is plotted in a column of ‘O’. Normally, three-box reversal criteria is used to define the trend & reversal. Unlike a bar or candle, the P&F column can have multiple sessions in it.
Link to know more about the subject:
https://t.co/2xtLAVPBvm
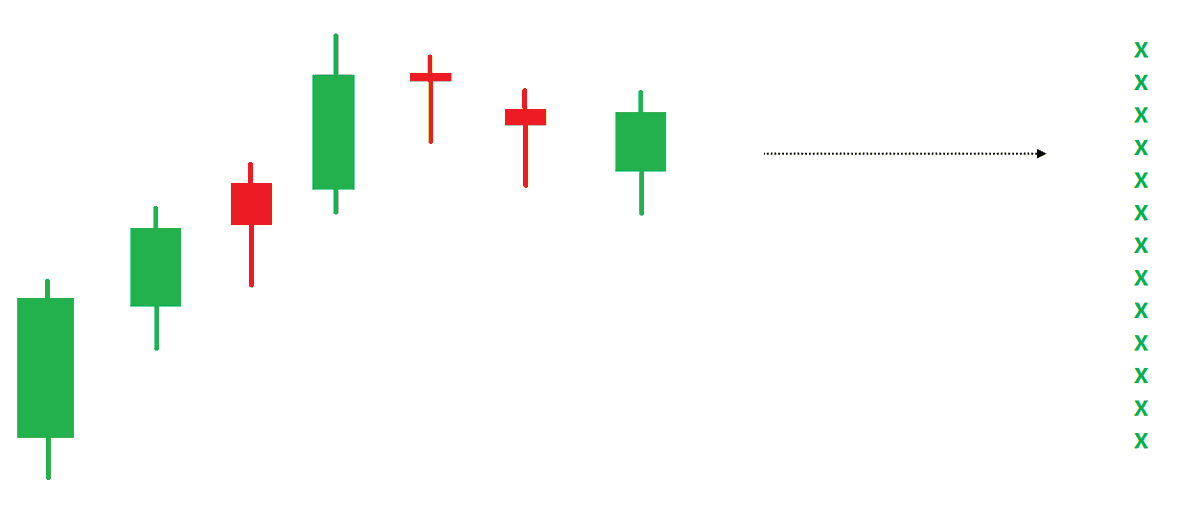
See below chart. Price is in a strong uptrend, P&F chart would produce a long of column of 'X' with more number of boxes in it.
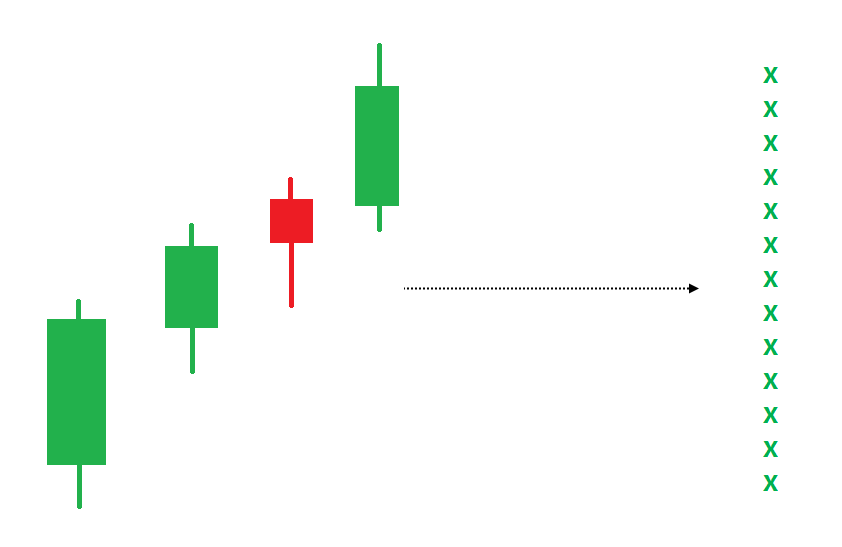
If such a trend is followed by some time bars without meaningful price correct, P&F chart would not move, and it will remain in column of 'X' in such a scenario.