🔸 Link:
https://t.co/zG165Xa3JB
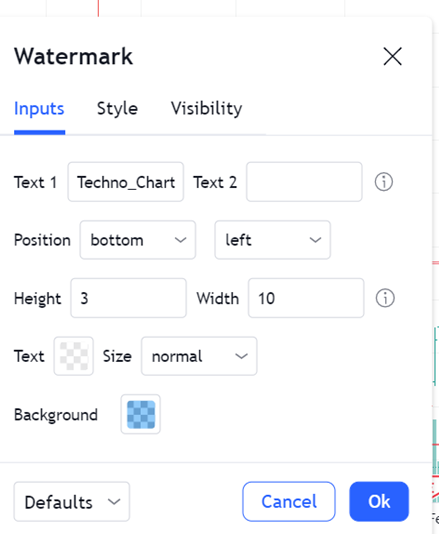
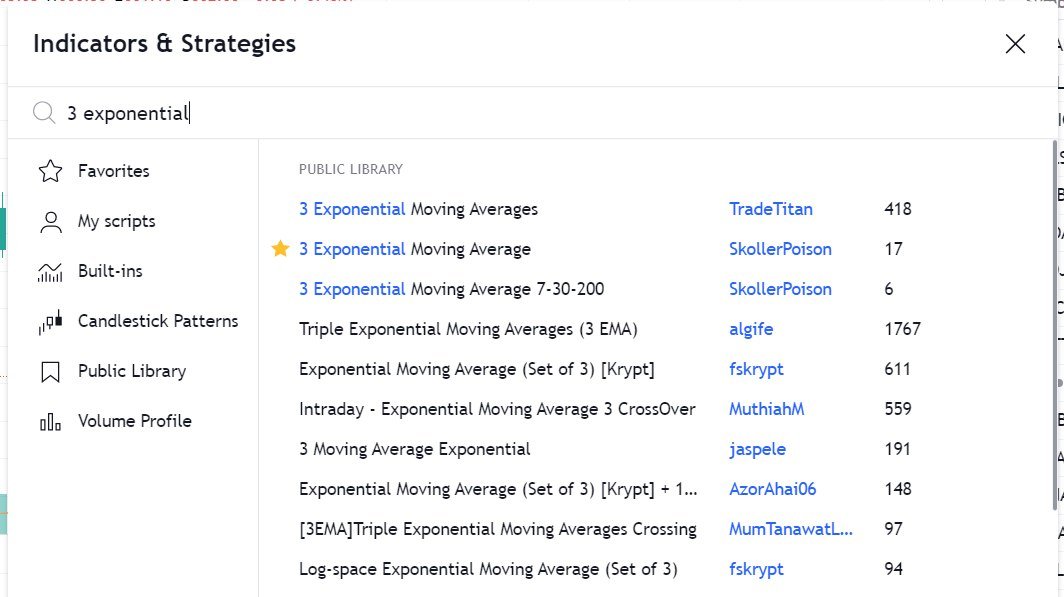
🔸 Click on the above link -> Add to Favourites -> Add on Chart from favourites and start using it !
2/20
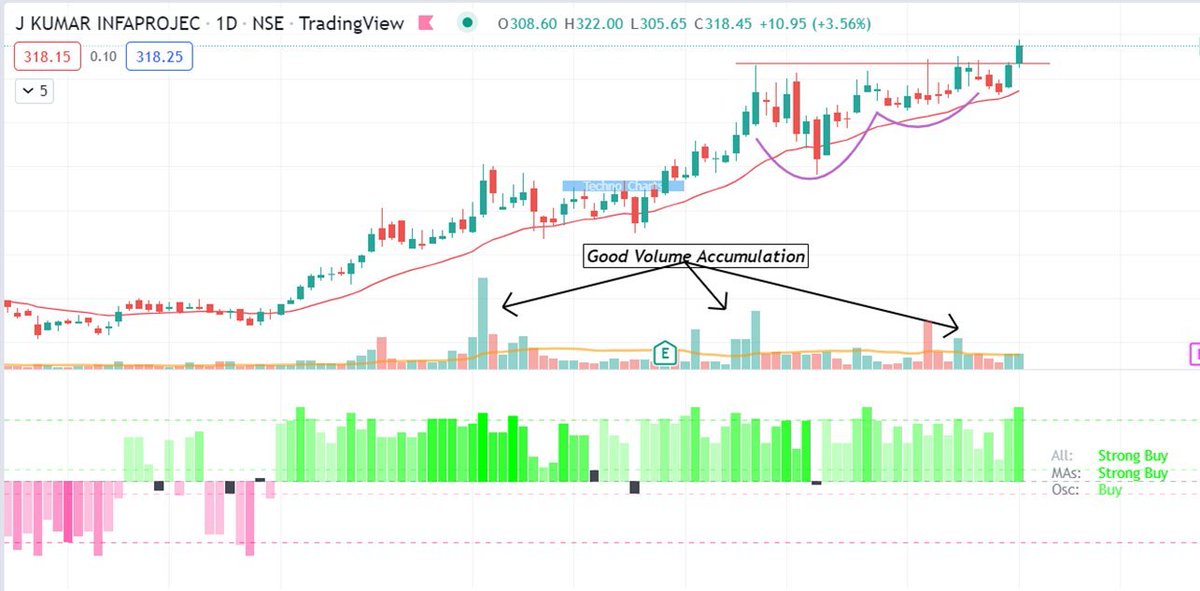
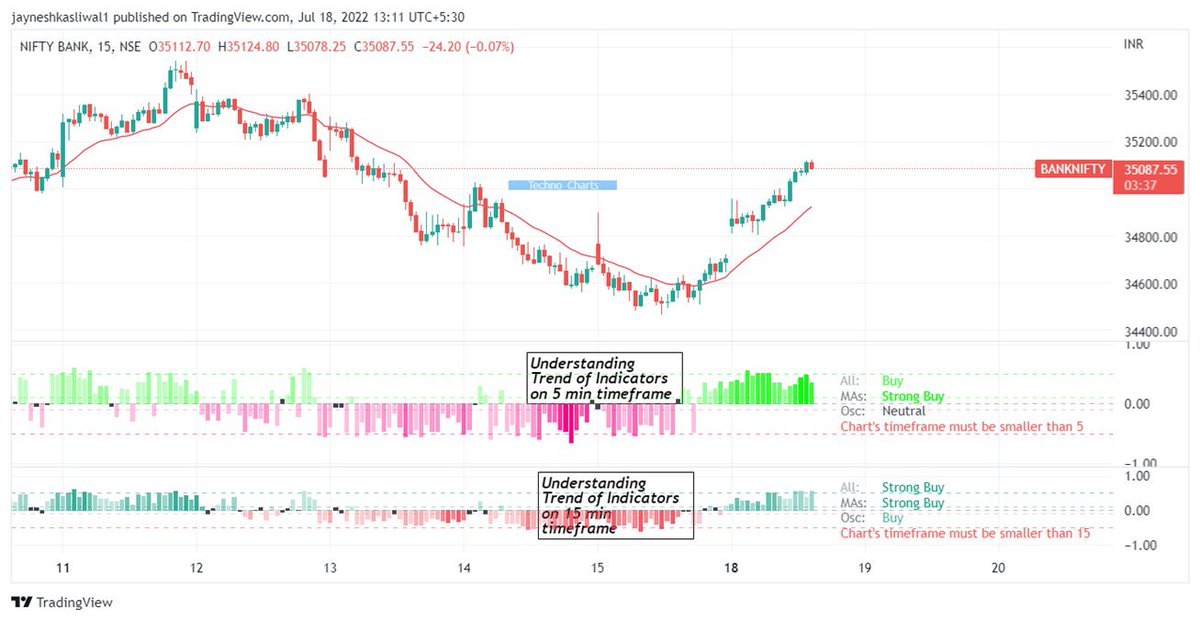
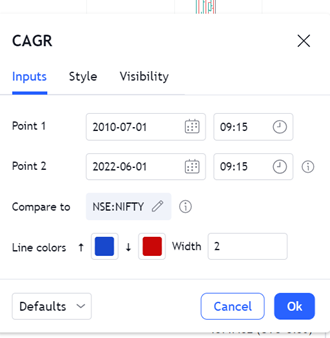
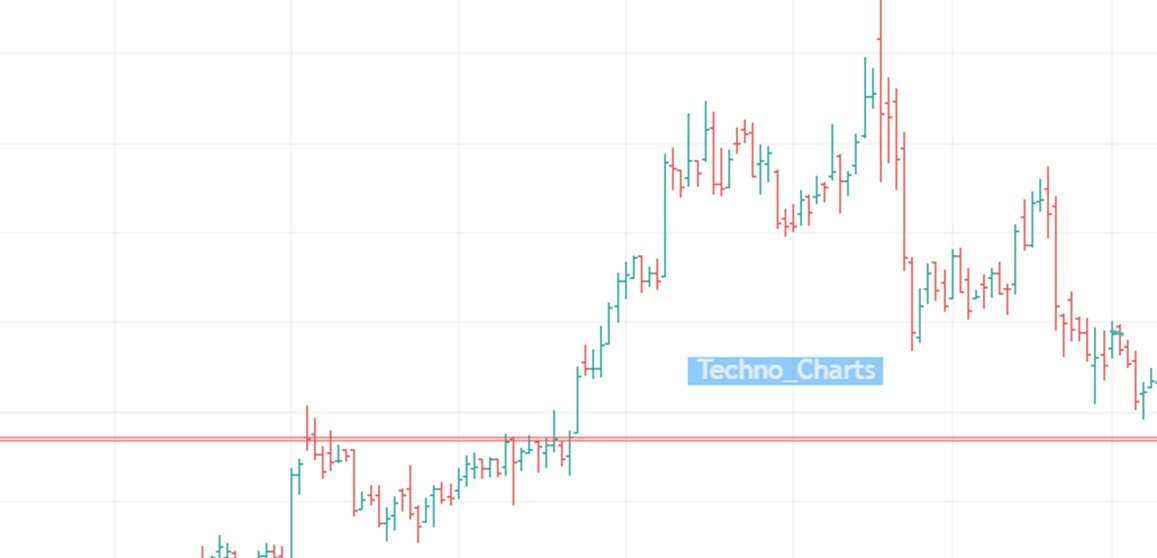
7 less known Tradingview Indicators that all traders should know about
— JayneshKasliwal (@JayneshKasliwal) June 2, 2022
A thread\U0001f9f5
I have designed many beginner to advanced
— JayneshKasliwal (@JayneshKasliwal) September 24, 2022
Option Strategies free of cost
Here is a thread of all \U0001f9f5
A Retweet would help :)

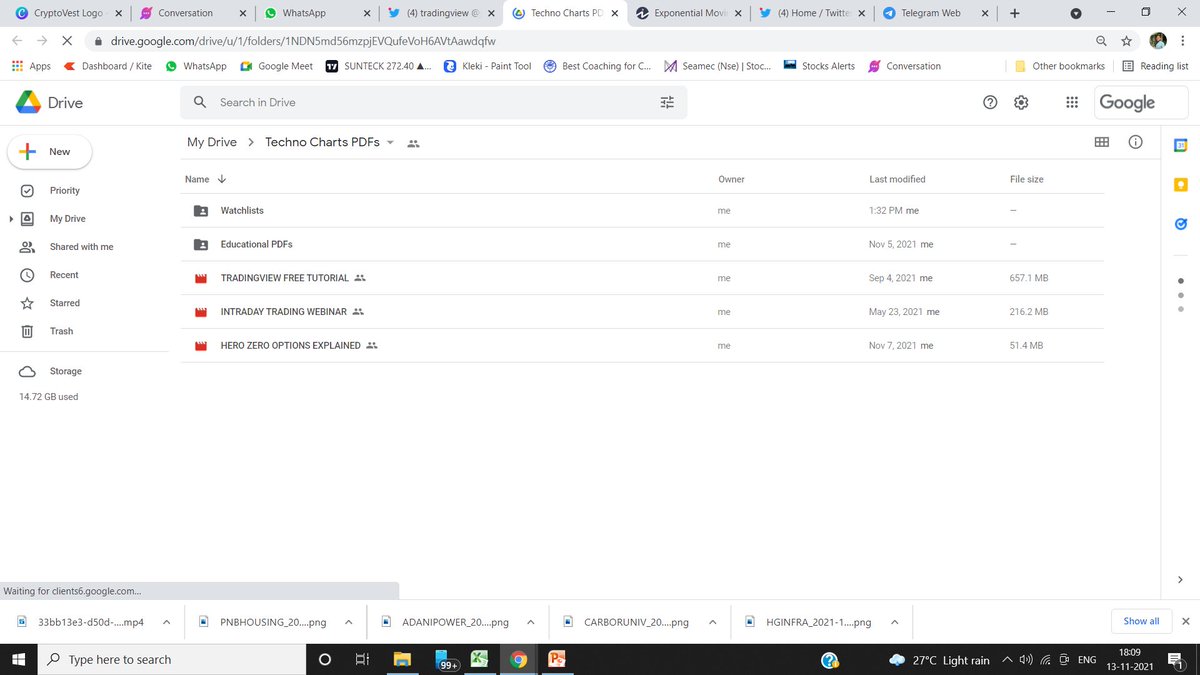
Drive Link for
— JayneshKasliwal (@JayneshKasliwal) November 5, 2021
Custom Made Pdfs on
1. Trading Strategies
2. Stock Selection
3. Tradingview Free Tutorial
4. Psychology https://t.co/9ukwfjLDYT
Retweet Share !@kuttrapali26 @MarketScientist @AmitabhJha3
I interviewed 5 billionaires this week
— GREG ISENBERG (@gregisenberg) January 23, 2021
I asked them to share their lessons learned on startups, life and entrepreneurship:
Here's what they told me:
To outperform, you need serious competitive advantages.
— Sahil Bloom (@SahilBloom) March 20, 2021
But contrary to what you have been told, most of them don't require talent.
10 competitive advantages that you can start developing today:
I\u2019ve gotten a lot of bad advice in my career and I see even more of it here on Twitter.
— Nick Huber (@sweatystartup) January 3, 2021
Time for a stiff drink and some truth you probably dont want to hear.
\U0001f447\U0001f447
THREAD: 10 significant lies you're told about the world.
— Julian Shapiro (@Julian) January 9, 2021
On startups, writing, and your career: