1/ Know your type:
First and foremost, understand whether you are a Scalper or Intraday trader or Swing trader or Positional Trader.
Create an account in
@tradingview
2/ Set the Time Frame (TF) of the Charts:
• Scalper: the TF you would use would be in the range of 1- 5min
• Intraday Trader: 5-15min TF
• Swing Trader: Hourly to Daily
• Positional Trader: Weekly
3/ Be aware of the trend at higher TF.
No matter which type of trader you are, its important to know the trend at higher TF.
Crucial to know whether its a buy on dip market or sell on rise market.
In my outlook for the week for #BANKNIFTY & #NIFTY I cover multi TF analysis.
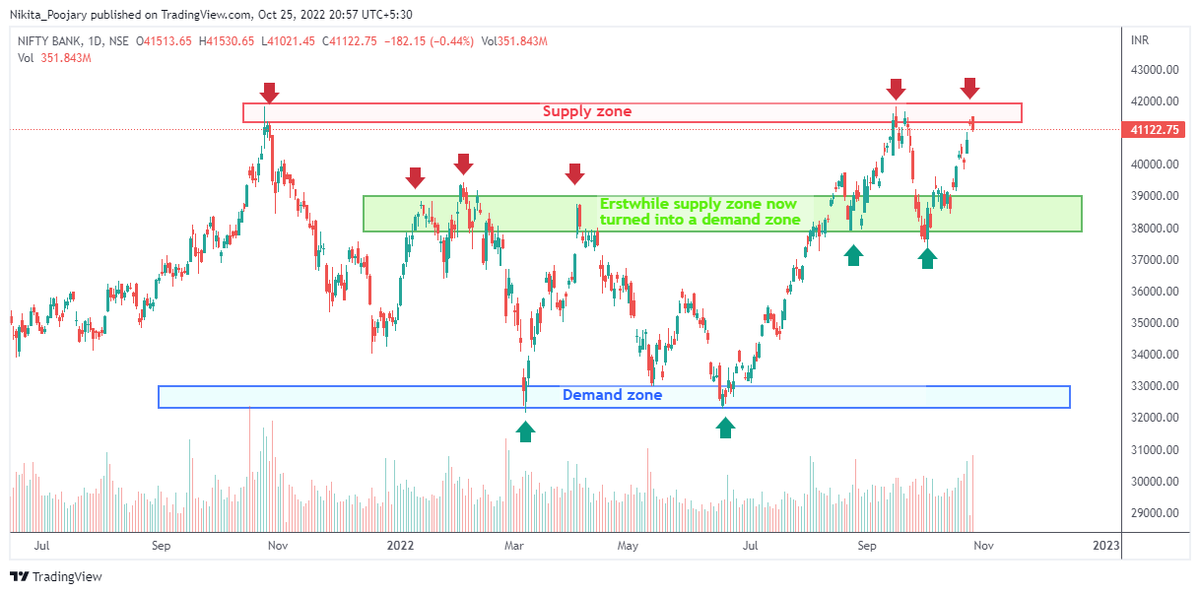
4/ Identify the major Demand & Supply Zone:
• A supply zone is the price area where traders have the highest selling interest or potential.
• A demand zone is the price area where the traders have the highest buying interest or potential.
5/ Find immediate supply and demand zone:
Usually the erstwhile resistance/ supply zone becomes a support/demand zone & vice versa
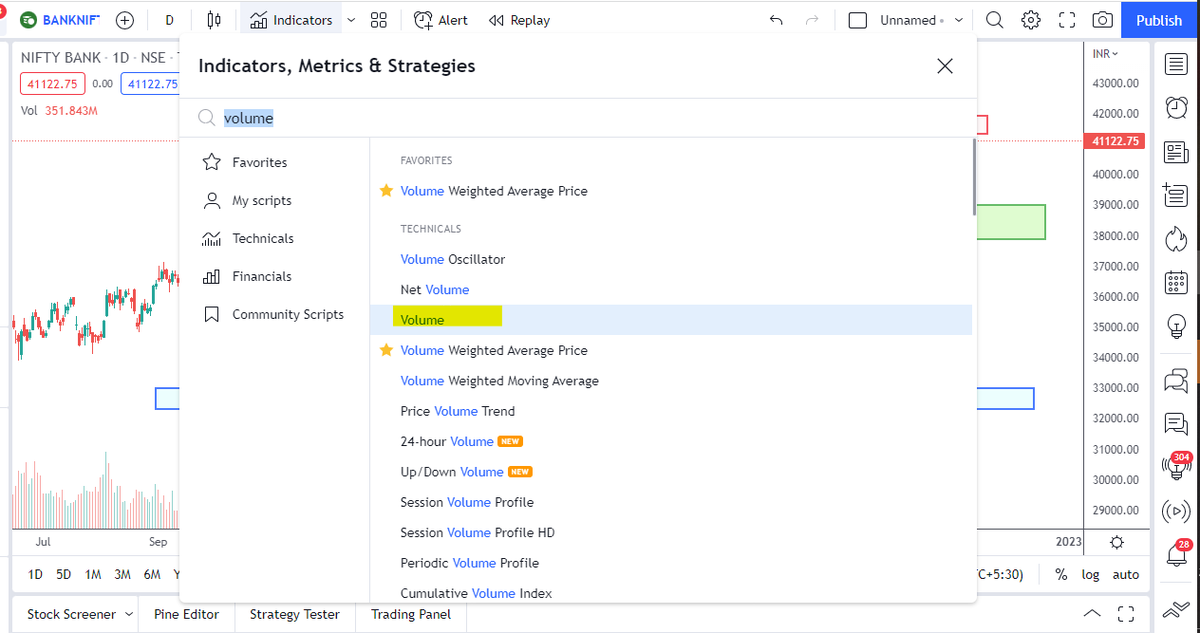
6/ Importance of Volume:
In
@Tradingview you can add indicator as Volume
• Above average and/or increasing trading volume can signal that traders are truly committed to a price move, where the price and volume lines are both increasing.
• Contrarily, below average and/or decreasing volume can signal a lack of enthusiasm, where volume is declining even as the price continues to move higher.
•Volume acts as an additional confirmation.
• BO or BD with volume is considered powerful.
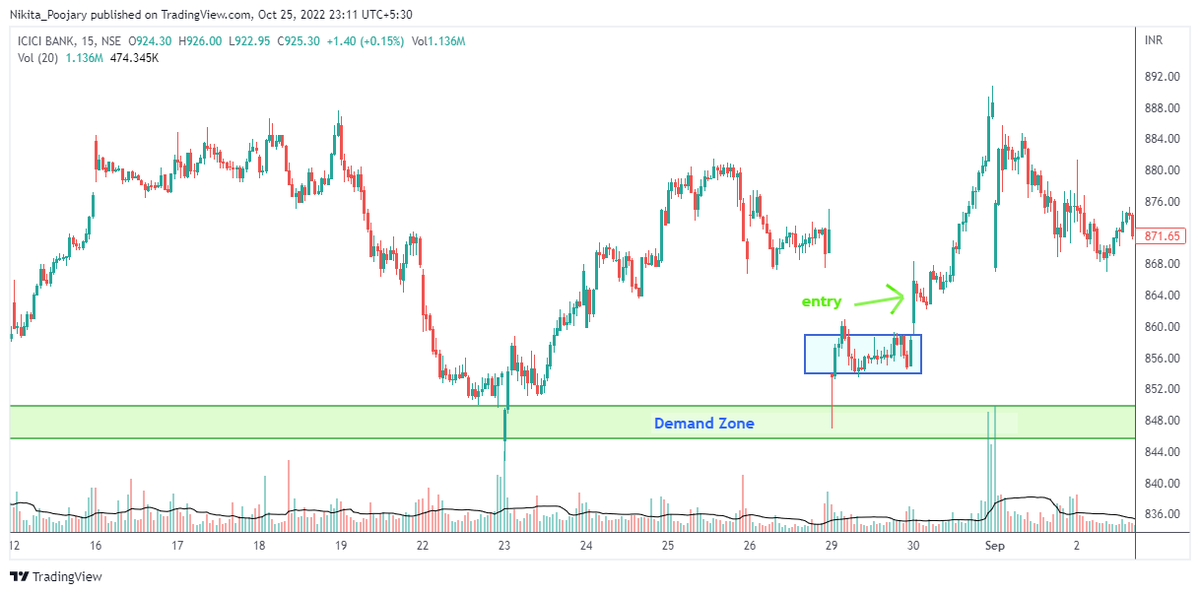
7/ How to determine Entry point:
Entry points in a trending market come after a short counter-trend move or a period of consolidation.
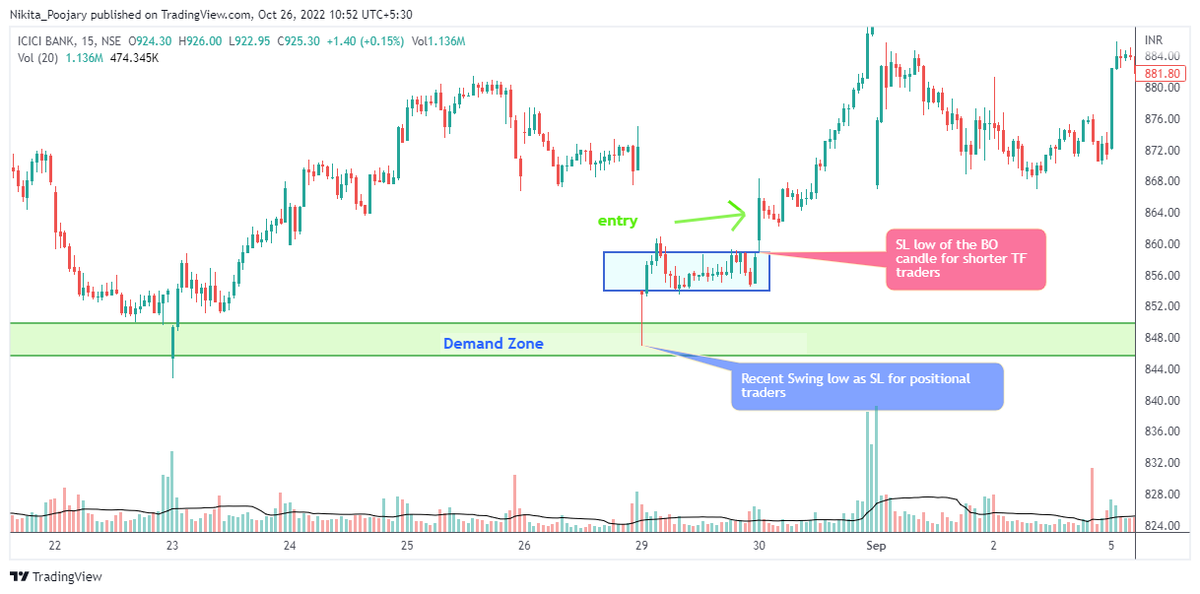
8/ Stop Loss (SL):
• One can either place a defined percentage i.e. Lets say a stock trading at Rs. 250 a 10% SL translates to Rs. 25.
• So if you are long on a stock at Rs. 250 the moment it hits Rs. 225 (250-25) you should be out of the trade.
• Another way of defining a SL is through charts, usually smaller TF traders would keep the SL as the low of the Breakout candle (for longs)
• Positional Traders would keep the SL of the latest swing low (for longs) as their SL.
9/ Position Sizing & Risk Management:
Check this link to calculate proper position sizing
https://t.co/InmdaHgNc7
10/ Trailing Stop Loss (TSL):
• If your trading system has a 1:4 Risk Reward then trail to cost the moment the R:R is 1:1 and so and so forth
• The other way is to maintain a TSL at a precise percentage below the market price (for longs)
• Can also trail basis the candles
11/ When to nail down the profits?:
• Firstly, one can sell into strength when the stock is moving in their favour and there are plenty of buyers
• The second technique is selling into weakness. Initially the stock made a good run-up but is weakening now.
• Technique by Mark Minervini explained in his book Think & Trade like a Champion
• Better to go for a combination of both wherein you book you anywhere between two thirds to three quarters of the holding by selling into strength and the balance keep trailing with tight SL.
• Remember, TSL & partial profit booking are very important for profit protection.
If you enjoyed this thread here's another one:
https://t.co/aO7ZY2zc6I
That's a wrap!
If you enjoyed this thread:
1. Follow us
@AdityaTodmal &
@niki_poojary for more threads on Price action, Option Selling & Trading strategies.
We've got you covered.
2. RT the first Tweet to share it with your audience.
I appreciate it!