This is what traditional volume analysis states. But in reality, how effective it is?
(2/n)
It simply shows volume from a timeframe basis. 5 mins volumes on 5 mins TF and so on.
But, is there a different way to read volumes from a price basis? Like, where did largest buying or selling by big players come in?
Read to find more.
(3/n)
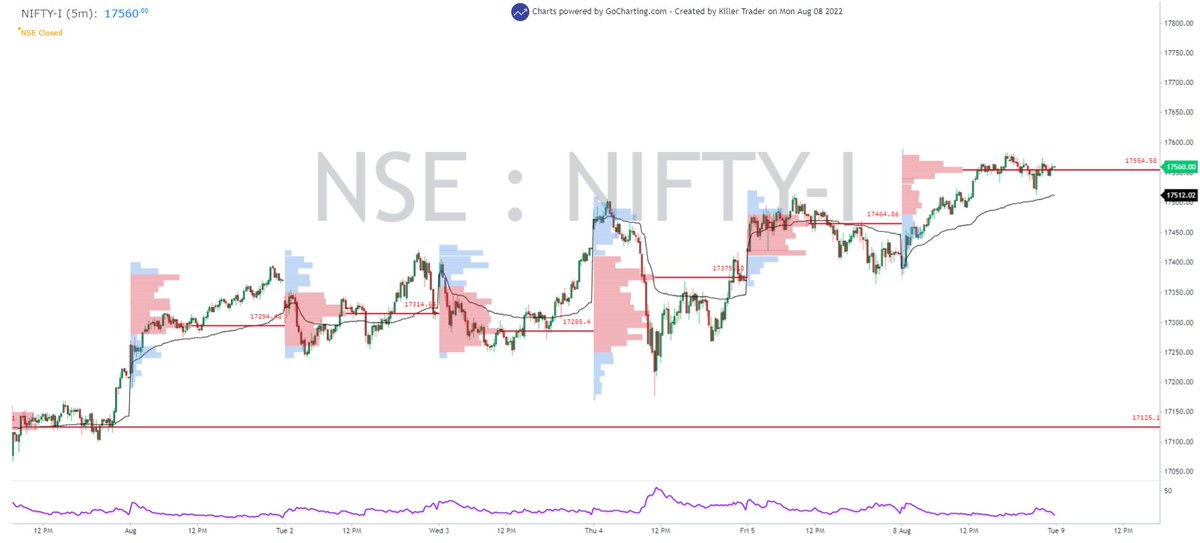
This is where volume profile comes in. To put it in the simplest way, volume profile shows volume from a price perspective thus enabling a trader to identify where largest trading has occurred.
But how does this help a trader?
(4/n)
If you can spot the areas where large volumes are being traded, you can spot areas of interest and effectively find areas of support and resistance.
Of course, it is volume that drives the price.
(5/n)
There are multiple types of volume profile. In this thread, we will discuss the session volume profile.
(6/n)
As name suggests, session profile means the volume profile for every trading "session"
This profile shows volume traded at every price point, irrespective of how many times price traded at a point.
(7/n)
For ex:, if market went to 17350F at 10:30, 11:00 and 3:00, the volume profile will show volumes traded at 17350F in total, irrespective of how many times price traded there in a session.
(8/n)
How to decode this tool?
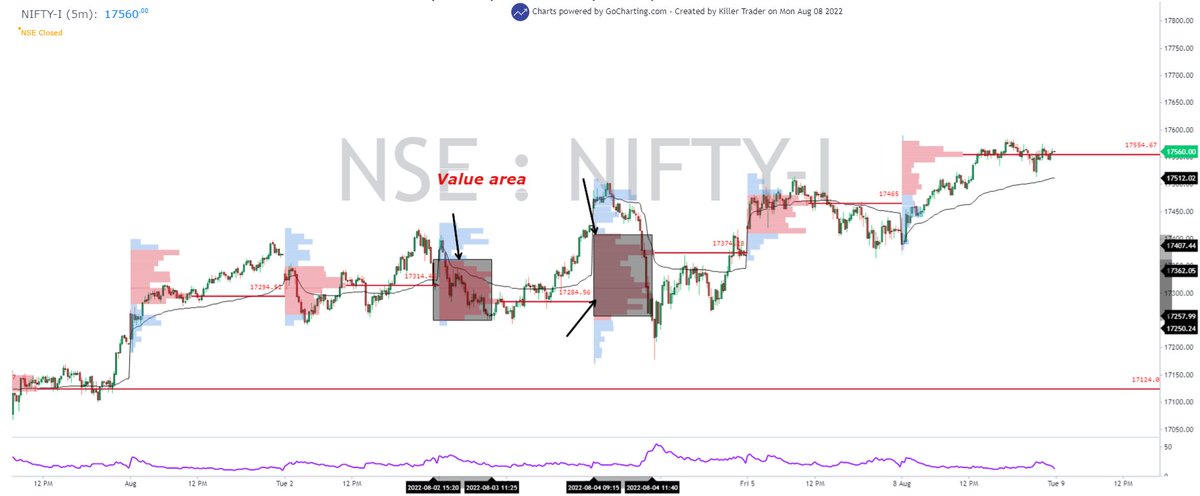
The red part of the tool is value area (68% of the total volumes traded) which is depicted by 1 SD - bell curve.
Value area indicates here the price zone where 68% of the highest volumes were traded in a trading session.
(9/n)
The other price zone apart from value area is shown in blue.
(10/n)
How to use this tool to improve your analysis and trading game?
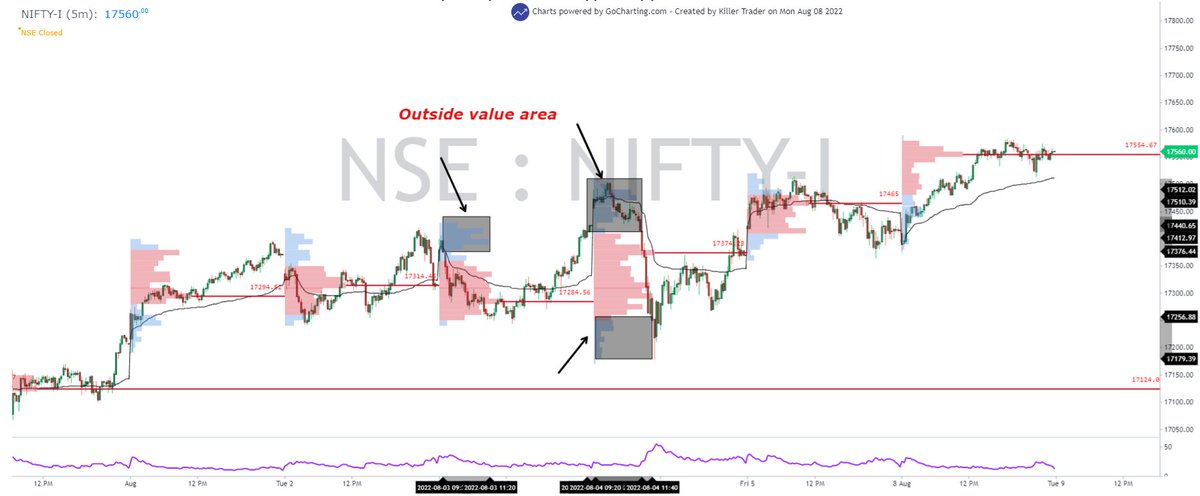
One of the many ways I use volume profile is to analyze current day (intraday) trend and context using previous day's value area.
(11/n)
What is value area? Value area tells me the price zone where highest volumes were traded yesterday - implying institutional interest.
Now, why is prev day important? The golden rule of intraday trading is: Every trading session is an extension of previous day's session
(12/n)
No trading session occurs in isolation. Positions created and unwinded by players prev day at specific price zones have an impact on current day movement.
(13/n)
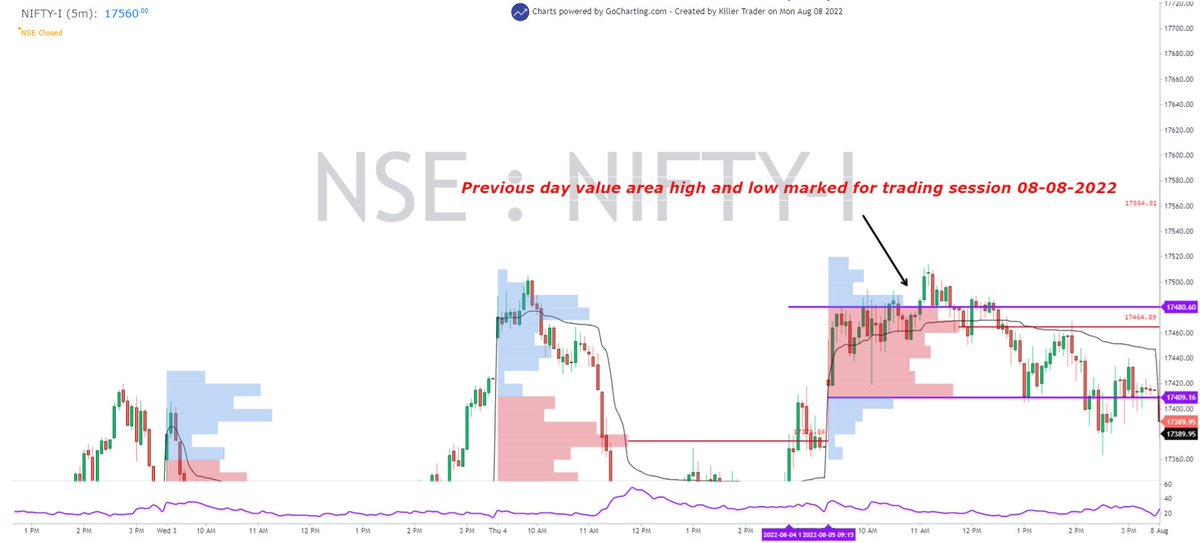
Plot value area high (VAH) and value area low (VAL) of previous day on your chart before market opens.
(14/n)
Opening is very important. See where market is opening and trading for initial 5 mins.
Both the VAH and VAL zones can be used as support and resistance by a trader; meaning both breakout and pullback traders can use it.
(15/n)
But how a type of trader uses it is different.
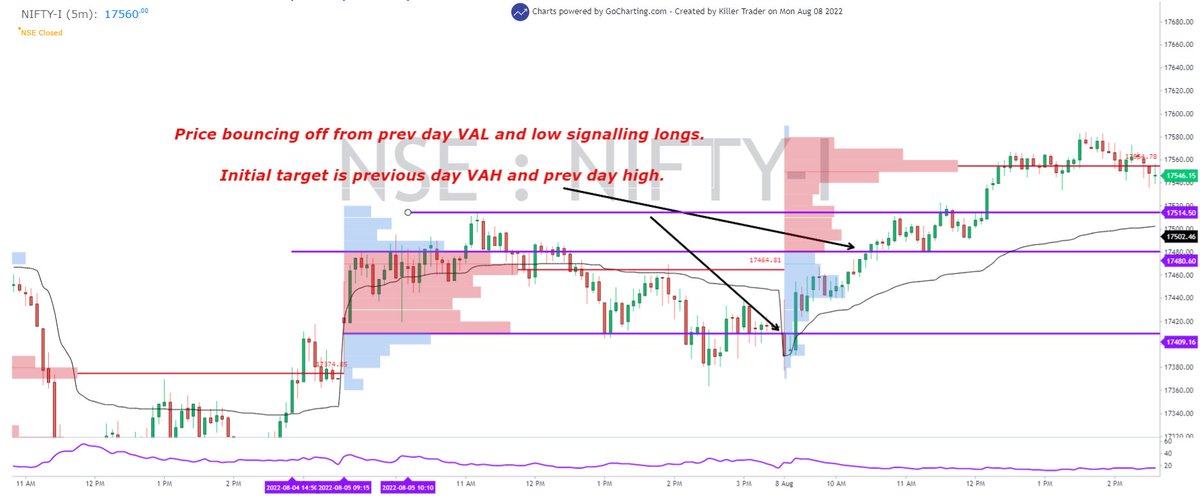
Ex: Today, we opened at prev yday VAL, took support there and started to move up. The issue is not short at market open. But price taking support at VAL and prev day low indicates traders should pack up shorts and be long
(16/n)
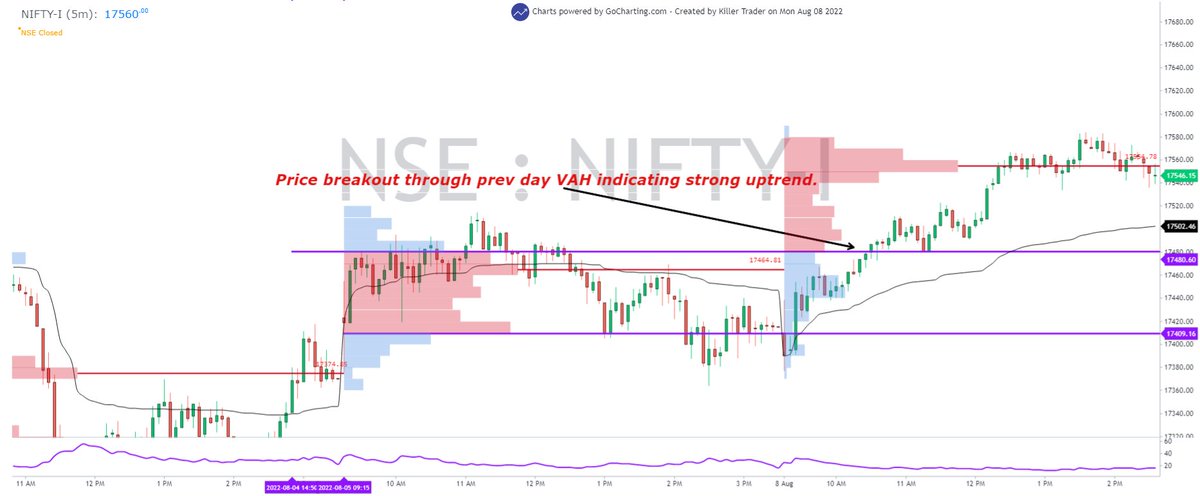
This was for intraday pullback traders. A breakout trader could have gone long when price broke through prev yday VAH indicating strong uptrend.
(17/n)
Previous day high and low are also imp references for a day trader to be considered.
One more example using volume profile:
(18/n)
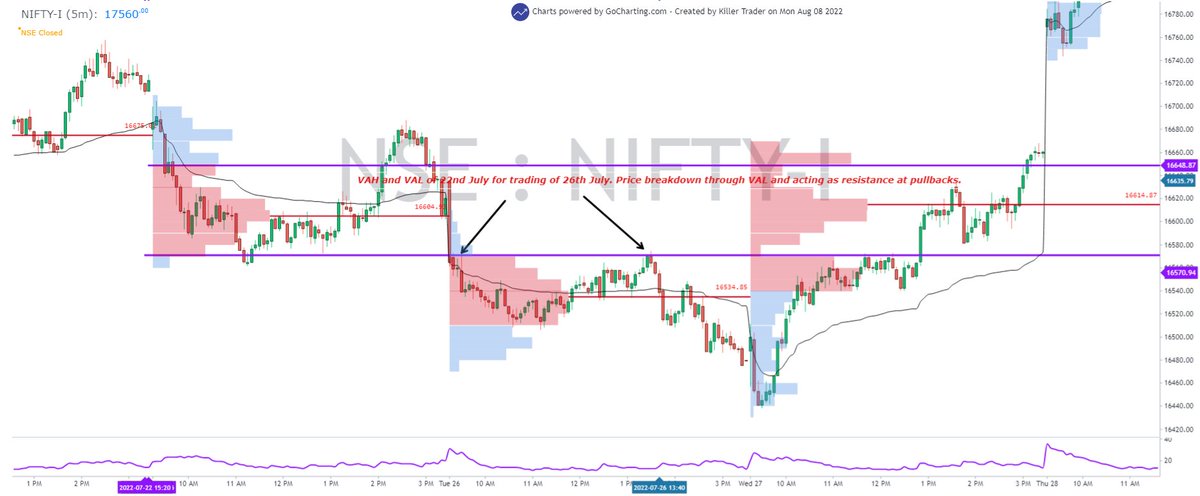
Price opened and went below prev day VAL at opening 5 mins. Area acted as subsequent resistance and can be used to short. VAL breakdown indicated strong downtrend.
(19/n)
What I shared here is one of the many techniques using volume profile I follow.
Now, with this info; what should you do as a trader:
1. Decide if you want to trade breakouts/downs or pullbacks.
(20/n)
2. Check charts and see how price reacted at VAH and VAL on various kind of openings. (price opening within prev day range, beyond prev day range)
3. Invest screen time reading and a strong understanding of volume profile.
(21/n)
4. Filters: This tool goes well with VWAP, AWAP and Pivots (only pivots, not S1 and R1)
5. TF to be used: 5 mins for option scalpers and 15 for future traders is ideally recc.
6. SL is breakout/breakdown candle high or low
7. TSL and profit booking can be on R or ATR
(22/n)
What I shared is one of my personal techniques. Do not go by the book or some YT videos. If it were that easy, everyone would do it.
Develop your own edge.
(23/n)
If you liked the contents of the thread, like and re-tweet it to motivate me and follow me below for more such knowledge 👇:
Twitter:
@KillerTrader_ TG:
https://t.co/3Jy68A2Cz6 Charts powered by
@gocharting #StockMarket #Nifty