Traditional idea of Volume:
- if the price increases with an increase in volume, it is BULLISH
- If the price is increasing without volume, it is BEARISH
- if the price is falling with an increase in volume, it is BEARISH
- if the price is falling without volume, it is BULLISH
But this doesn't hold good every time!
Let's look at some examples.
Ex #1: Tata Consumer (Daily Chart)
Here the price has gone upside from 640 to 780 without any increase in the volume!
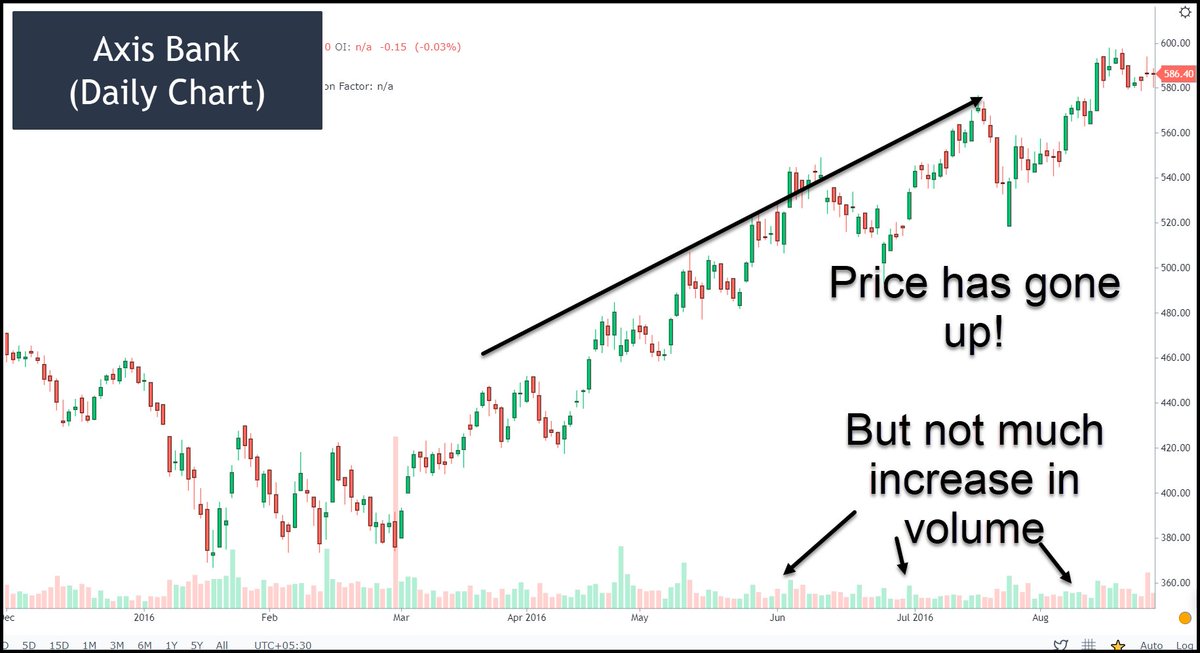
Ex #2: Axis Bank (Daily Charts)
Here the price has gone up from 420 to 580 without much increase in the volume.
Do you think it can happen only in an uptrend?
Look at these charts!
Ex #3: Reliance (Daily chart)
Reliance fell from 1620 to 1300 without an increase in volume!
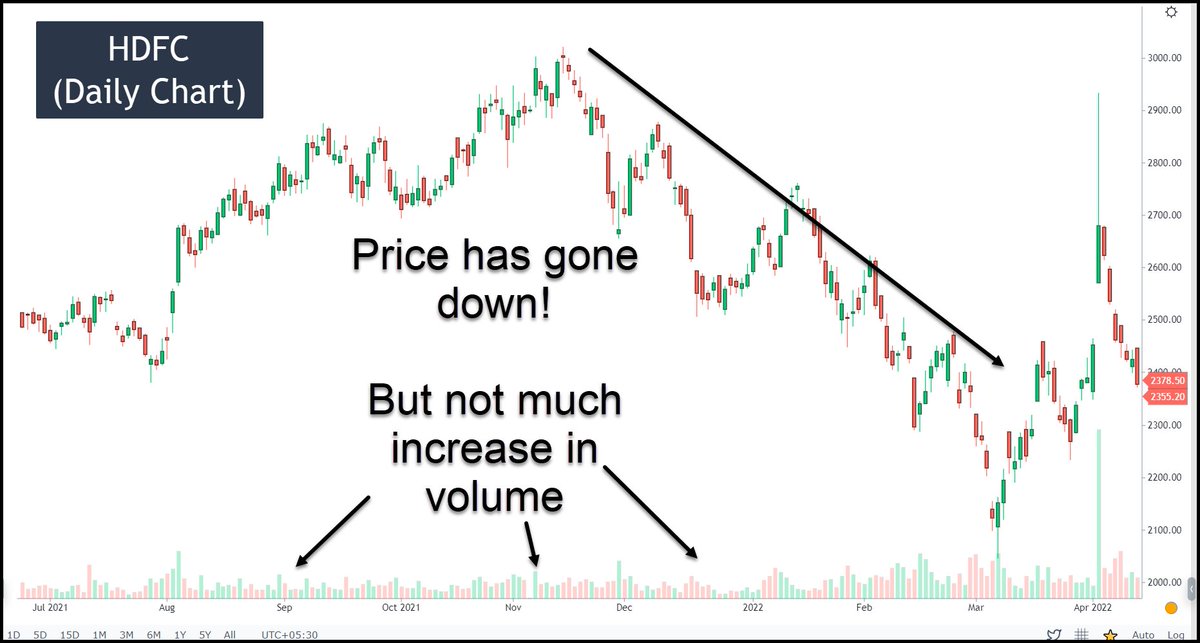
Ex #4: HDFC (Daily Charts)
HDFC shares fell from 3000 to 2100 without much increase in volume!
Are you thinking this can happen only in "DAILY CHARTS"?
Have a look at these charts!
Ex #5 - Kotak Bank (Hourly Chart)
Kotak Bank fell from 1850 to 1740 without any volume spikes!
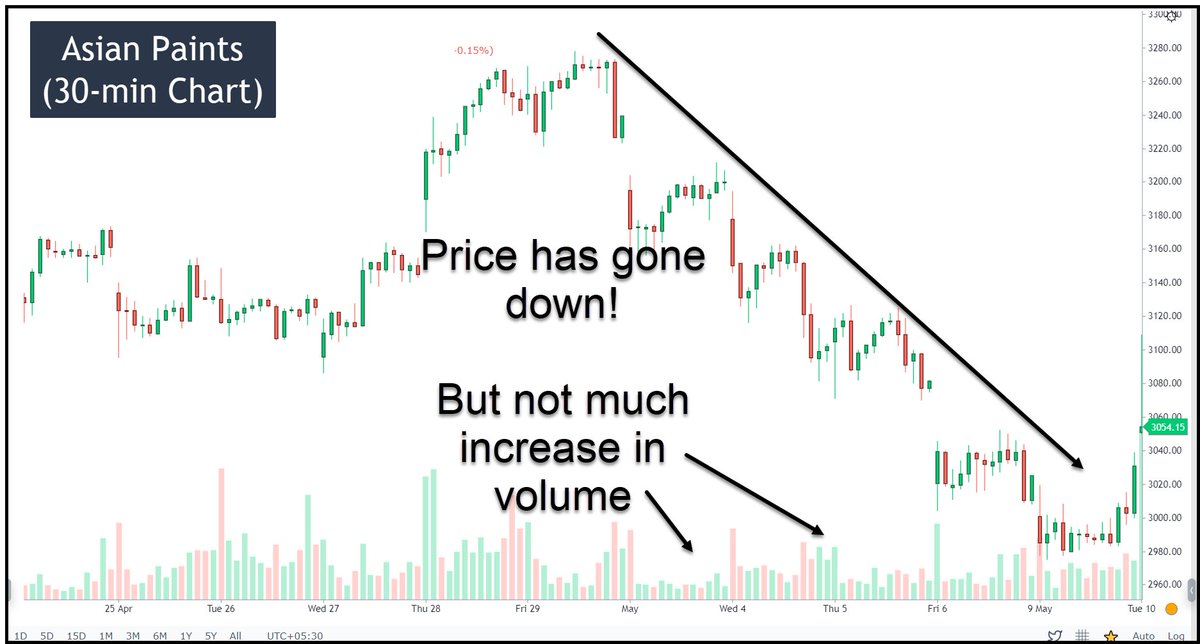
Ex #6: Asian Paints (30 min chart)
Asian Paints fell from 3280 to 2980 without an increase in volume!
Do you think these are some cherry-picked operators' stocks?
Most of the above stocks fall in Nifty-50!
It is easily understandable that these points bring a lot of doubt and uneasiness as it shakes the basic foundation of 'volume' itself.
Look at some indices (at least no one can operate the index)
Ex #7: Nifty Futures chart
So, what are the Important Lessons to know about Price-Volume?
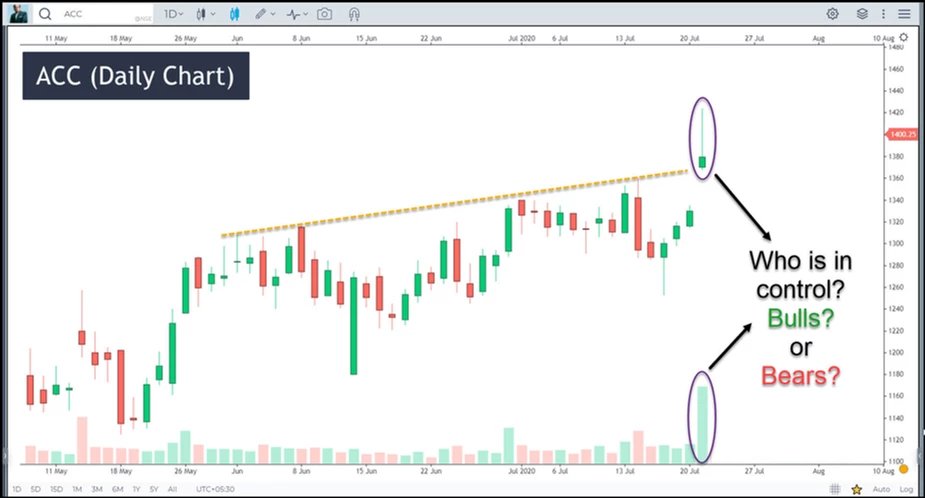
Lesson #1 Volume Colour cheats you!
If you don't believe, answer this question.
So, in your opinion, who has significant participation in the volume? Buyers or Sellers?
If your answer is ‘Buyers,’
Then there is a severe mismatch between your understanding and reality because you are giving more importance to the ‘green’ color code of the volume spike.
Sellers should be absent at the resistance to give further move on the upside
But look at the breakout candle. It has a selling wick that is about 70% of the body (means 70% of them are sellers)
You have developed a bullish view after looking at the big green color volume spike
Lesson #2
The price can go with more volume, medium volume, and less volume.
The price can go down with more volume, medium volume, and less volume.
Please don't believe this statement until you verify it on the charts!
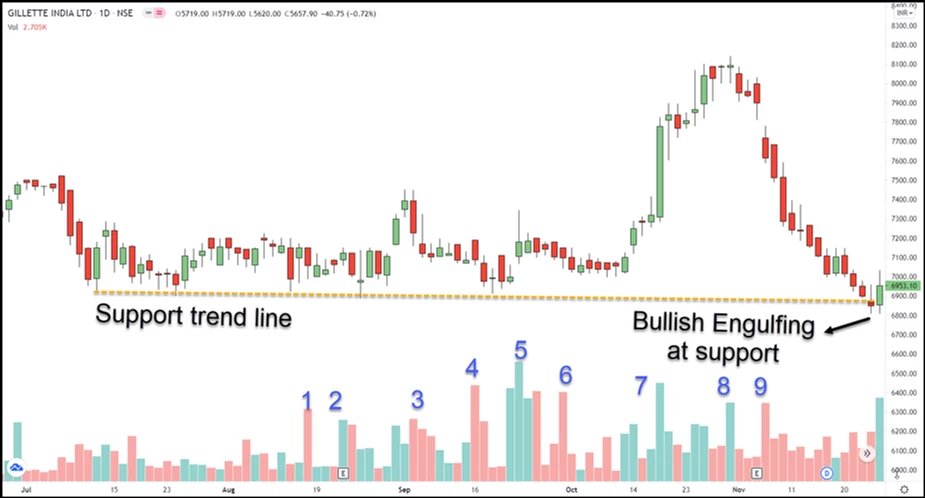
Lesson #3 Analyze Each Volume Spike
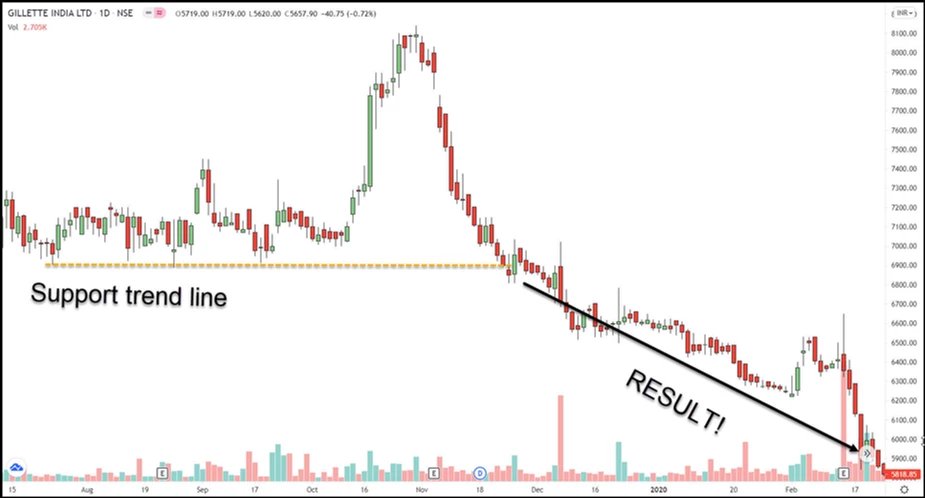
In the below chart, the price is near the support trend line.
Do you think the price will go upside from here?
To decide whether the support will hold or not through ‘volume,’ we need to analyze the significant volume spikes.
I have marked Nine significant volume spikes on the chart, and I analyze these spikes below.
Spike 1 has some buying wick, but the price didn’t go up. Hence, I mark this spike as neutral.
Spike 2 – No wick, but the price fell the next day. Hence, I mark this spike as bearish.
Spike 3 – Again there is a big selling wick, and also the price fell later. Hence, I mark this spike as bearish.
Spike 4 – Not much wick, but the price fell on the next day. Hence, I mark this spike as bearish.
Spike 5 – Big selling wick, but the price went on sideways for the next day. Hence, I mark this spike as bearish.
Spike 6 – There is a slight buying wick, but the price fell on the next day. Hence, I mark this spike as neutral.
Spike 7 – Slight wick on both sides, and the price went upside on the next day. Hence, I mark this spike as bullish.
Spike 8 –Wick on both sides, but the price fell the next day. Hence, I mark this spike as bearish.
Spike 9 –No wick on both sides, but the price fell the next day. Hence, I mark this spike as bearish.
Now there are 9 volume spikes - 6 bearish volume spikes, 1 bullish spike, &2 neutral spikes.
Hence, there is a high probability of the price breaking the support trend line.
You can look at the result in the below image.
That's a wrap!
If you enjoyed this thread:
1. Follow me
@indraziths for more threads on the stock market trading
2. RT the tweet below to share this thread with your audience
One can also check my latest book on intraday trading and options trading
https://t.co/JhVOIAceyg