Ashishra11's Categories
Ashishra11's Authors


Latest Saves
It's much more powerful than you think
9 things TradingView can do, you'll wish you knew yesterday: 🧵
Collaborated with @niki_poojary
1/ Free Multi Timeframe Analysis
Step 1. Download Vivaldi Browser
Step 2. Login to trading view
Step 3. Open bank nifty chart in 4 separate windows
Step 4. Click on the first tab and shift + click by mouse on the last tab.
Step 5. Select "Tile all 4 tabs"
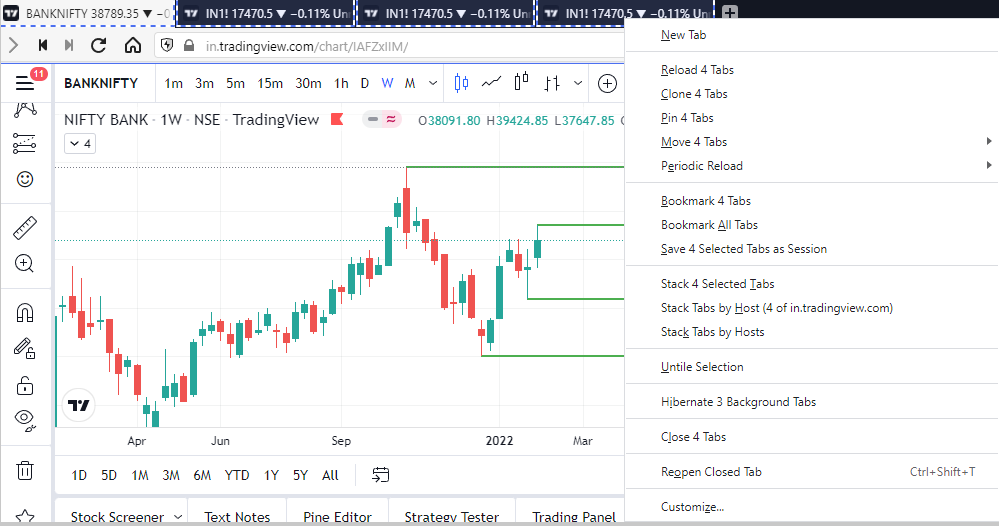
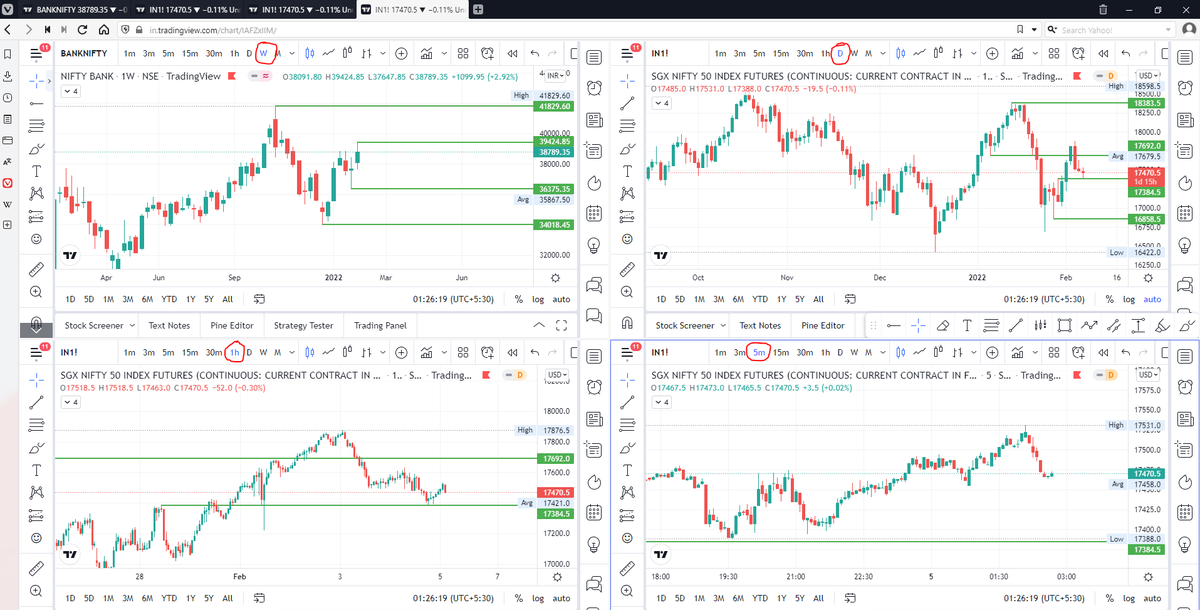
What happens is you get 4 charts joint on one screen.
Refer to the attached picture.
The best part about this is this is absolutely free to do.
Also, do note:
I do not have the paid version of trading view.
2/ Free Multiple Watchlists
Go through this informative thread where @sarosijghosh teaches you how to create multiple free watchlists in the free
\U0001d5e0\U0001d602\U0001d5f9\U0001d601\U0001d5f6\U0001d5fd\U0001d5f9\U0001d5f2 \U0001d600\U0001d5f2\U0001d5f0\U0001d601\U0001d5fc\U0001d5ff \U0001d604\U0001d5ee\U0001d601\U0001d5f0\U0001d5f5\U0001d5f9\U0001d5f6\U0001d600\U0001d601 \U0001d5fc\U0001d5fb \U0001d5e7\U0001d5ff\U0001d5ee\U0001d5f1\U0001d5f6\U0001d5fb\U0001d5f4\U0001d603\U0001d5f6\U0001d5f2\U0001d604 \U0001d602\U0001d600\U0001d5f6\U0001d5fb\U0001d5f4 \U0001d601\U0001d5f5\U0001d5f2 \U0001d5d9\U0001d5e5\U0001d5d8\U0001d5d8 \U0001d603\U0001d5f2\U0001d5ff\U0001d600\U0001d5f6\U0001d5fc\U0001d5fb!
— Sarosij Ghosh (@sarosijghosh) September 18, 2021
A THREAD \U0001f9f5
Please Like and Re-Tweet. It took a lot of effort to put this together. #StockMarket #TradingView #trading #watchlist #Nifty500 #stockstowatch
3/ Free Segregation into different headers/sectors
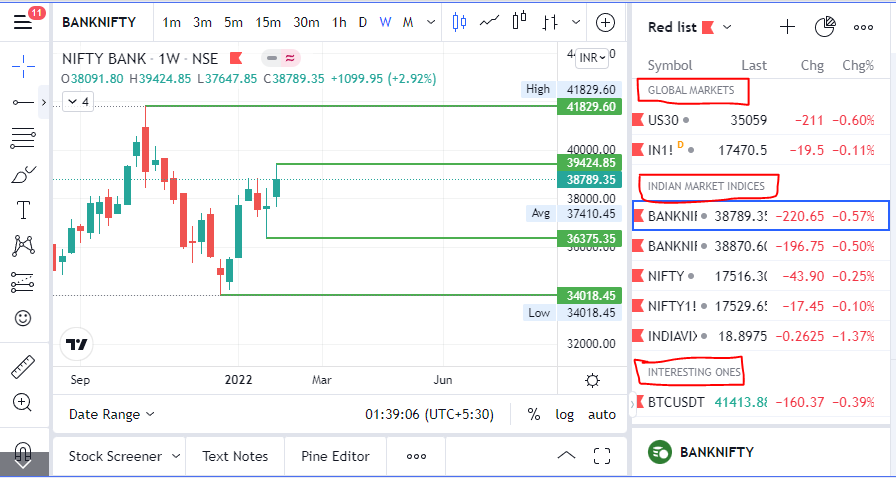
You can create multiple sections sector-wise for free.
1. Long tap on any index/stock and click on "Add section above."
2. Secgregate the stocks/indices based on where they belong.
Kinda like how I did in the picture below.
Topic: Why are FII's selling so
1. Why are FIIs selling Indian stocks so vigorously?
— Vivek Thebaria (@vivekthebaria) January 28, 2022
Well, a number of factors. It's actually a domino effect.
And it all begins with the same story\u2026
The day FED decided to go hard on inflation. pic.twitter.com/unYzHWGPsE
Topic: What moves the gold
What moves the #Gold price? \U0001f9f5
— Kirtan A Shah (@KirtanShahCFP) January 30, 2022
It is said that gold is an Inflation hedge. But if you look at the historical data points, Gold has not really been able to live upto the expectations, lets discuss.
Do hit the \u2018re-tweet\u2019 and help us educate more investors. (1/14)#Investing
Topic: Learn to have a long-term
Three big mistakes, taught me long term perspective.
— Chander Bhatia (@ChanderBhatia01) February 2, 2022
1) Bought Infosys in 1995-96, sold with some profit in 1996. It is 1500X.
2) Bought Shree Cement in 2000, sold after two years with no profits. It is 600X.
3) Bought Aarti ind. in 2008, sold in 2013 with 2-3X. It is 80X.
Topic: Economic survey for
\U0001f1ee\U0001f1f3 Economic Survey for 2021-22 released.
— Lalit Rathi (@lalitinvestor) January 31, 2022
\U0001f447Detailed thread of 440 page survey.!\U0001f9f5
Some very interesting data points \U0001f4da
RT for reach\U0001f5e3\ufe0f


Topic: Increase in yield panic for global
\u201cWhy increase in yield is creating panic for equity markets globally?\u201d \U0001f9f5
— Kirtan A Shah (@KirtanShahCFP) January 23, 2022
Do hit the \u2018re-tweet\u2019 and help us educate more investors (1/n)#investing #StockMarket
Topic: Should you buy the
A lot of messages asking me if one should exit FDs, Debt funds & buy the dip. This is what I am saying: Not every dip is like March 2020 where the bounce back is immediate. This time around, if things get worse, it may take a long time to recover. Nobody knows. 1/5
— Nithin Kamath (@Nithin0dha) January 27, 2022
Topic: Tips to improve your
Thread on some pro tips which will help you improve your trading to next level(My 6 year experience summed up in a thread)
— ARJUN BHATIA (@ArjunB9591) January 26, 2022
1. The more you sweat during practice , the less you will bleed during war - " Take time in learning , take small steps , increase your observation power ,
Topic: Data analysis Pre & Post
I'm not the biggest fan of technical analysis, but here's some data on the budget.
— Nikhil Kamath (@nikhilkamathcio) January 27, 2022
Expect volatility post-event: In only 8 out of the last 22 years have the markets moved lesser than 4 percent plus/minus in the post-budget month pic.twitter.com/vDKNq4pKCR
🧵on
• Uses of Relative Strength
• 3 indicators to help you make 3-5% a month swing trading.
• Uses of MACD indicator
• 10 reasons to book profits on India. Explained with reasons.
• TradingView Hacks.
The right way to ask doubts on social media, brilliant and very useful
How to Ask a Good Doubt in Social Media?
— Aneesh Philomina Antony (ProdigalTrader) (@ProdigalTrader) November 11, 2021
Part 1: Appreciate
If u are asking a doubt in reply to a tweet, appreciate the tweet first. Or if u are making a new tweet altogether, appreciate the person for his skills and knowledge.
1/6
🧵on "Uses of Relative
#RS is an indicator which helps in finding strong stock or index in the market.
— Yash Mehta (@YMehta_) November 12, 2021
This learning thread would be on
"\U0001d650\U0001d668\U0001d65a\U0001d668 \U0001d664\U0001d65b \U0001d64d\U0001d65a\U0001d661\U0001d656\U0001d669\U0001d65e\U0001d66b\U0001d65a \U0001d64e\U0001d669\U0001d667\U0001d65a\U0001d663\U0001d65c\U0001d669\U0001d65d"
Shared some strategy.
Like\U0001f44d & Retweet\U0001f504for wider reach and for more such learning thread in the future.
1/22
🧵3 indicators to help you make 3-5% a month swing trading.
Swing Trading Strategy
— JayneshKasliwal (@JayneshKasliwal) November 12, 2021
That can help you generate 3 to 5% Monthly
A thread \U0001f4d5
Using RS , MACD , 21 EMA and Price Action
All Concepts Explained !
RETWEET AND SHARE !#StockMarket @kuttrapali26 @ArjunB9591
1/n
10 stock Ideas for 10
10 stock Ideas for 10 years\U0001f40e
— EquiAlpha -MidTerm Momentum\U0001f40e\U0001f40e (@equialpha) November 5, 2021
\U0001fa81Titan Ltd
\U0001fa81LTTS
\U0001fa81Divis Lab
\U0001fa81HDFC AMC
\U0001fa81Astral Poly
\U0001fa81CAMS
\U0001fa81Bajaj Finance
\U0001fa81Kajaria Ceramics
\U0001fa81Polycab
\U0001fa81Icici bank
Accumulation in any fall is good


1. Moving Averages Ultimate Guide
2. All About ADX
3. Super Performance Using RELATIVE STRENGTH
Retweet and Share
Moving Average
The Ultimate Guide to moving averages !
— JayneshKasliwal (@JayneshKasliwal) November 30, 2021
A mega thread to understand the Use of 21 , 50 and 200 ema.
4 Effective uses of Exponential Moving Averages !
Retweet and Share \U0001f504#stockmarkets #nifty @kuttrapali26 @caniravkaria
All about
A Thread on indicator : ADX
— JayneshKasliwal (@JayneshKasliwal) January 1, 2022
Average Directional Index a Quick Guide
Retweet Share !@Techno_Charts
1/n pic.twitter.com/wRvQo5JNKN
Super Performance Using RELATIVE STRENGTH
A Mega Thread on RELATIVE STRENGTH
— JayneshKasliwal (@JayneshKasliwal) January 10, 2022
A method to improve
Stock Selection and Conviction in trades
Retweet \U0001f504And Follow @JayneshKasliwal


A thread 🔖
Tradingview is one of the most used Trading Websites in the world used by most traders .
Retweet Share !
@kuttrapali26 @AmitabhJha3
#stockstowatch #StockMarketindia
1/n
Trick to Add Unlimited Watchlists in
#Tradingview free Version
Step 1 : Open Trading View Mobile App
Step 2 : Click on " + "
Step 3 : Create Watchlist
This works only on Mobile app
After making Watchlist on Mobile app you can add stocks in Website also .
2/n

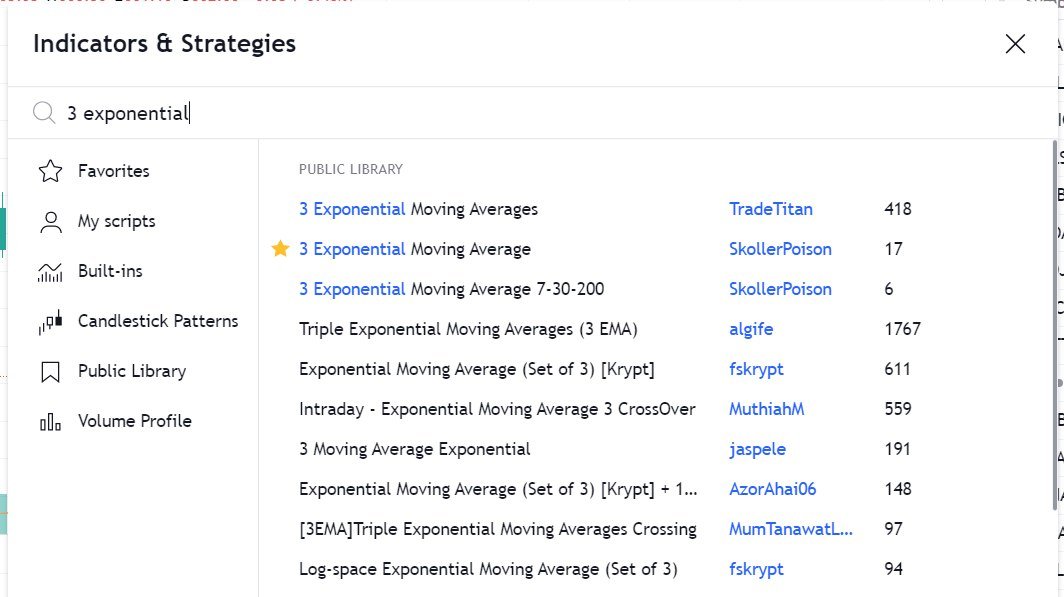
HOW TO APPLY MORE THAN 3 MOVING AVERAGES IN #TradingView Free Version
Step 1 : Just Write "3 expo "
You will get multiple Options
Select "skollerposion"
Step 2 : TO add Normal moving Averages refer the 2nd Picture
Add other indicators as your own
3/n
Link for Tradingview Free tutorial :
https://t.co/jx2gJEEC0t
Watchlist of FnO Midcap Largecaps etc shared
Copy watchlist from the folder and paste it through webiste only .
Copy Paste doesnt work in App
4/n
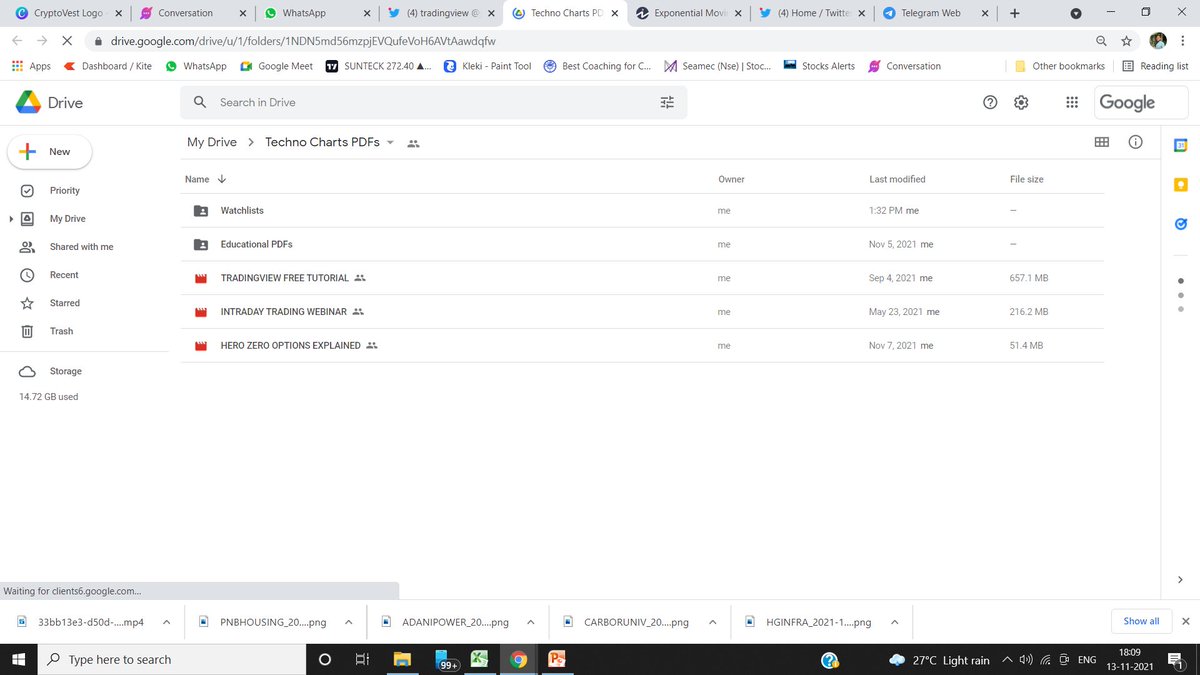
Drive Link for
— JayneshKasliwal (@JayneshKasliwal) November 5, 2021
Custom Made Pdfs on
1. Trading Strategies
2. Stock Selection
3. Tradingview Free Tutorial
4. Psychology https://t.co/9ukwfjLDYT
Retweet Share !@kuttrapali26 @MarketScientist @AmitabhJha3

This learning thread would be on
"𝙐𝙨𝙚𝙨 𝙤𝙛 𝙍𝙚𝙡𝙖𝙩𝙞𝙫𝙚 𝙎𝙩𝙧𝙚𝙣𝙜𝙩𝙝"
Shared some strategy.
Like👍 & Retweet🔄for wider reach and for more such learning thread in the future.
1/22
Most of us would confuse it with Relative Strength Index (RSI) but Relative Strength is a different indicator.
We have already covered about "Uses of RSI" in below thread👇
https://t.co/oTOrW7joNI
One can go through this if you haven't.
2/22
#RSI is a common indicator which most of us use in the stock market.
— Yash Mehta (@YMehta_) October 22, 2021
This learning thread would be on
"\U0001d650\U0001d668\U0001d65a\U0001d668 \U0001d664\U0001d65b \U0001d64d\U0001d64e\U0001d644"
Like\U0001f44d & Retweet\U0001f504 for wider reach and for more such learning thread in the future.
Also, an investment strategy is shared using RSI in the end.
1/16
Now coming to Relative Strength (RS).
It is basically a strategy used in momentum investing which shows strength or weakness between two asset classes (two stocks, index, commodity).
One can read about this in below
As of now, I am using this indicator on .@tradingview platform.
It's free and one can add it in their Tradingview account as well, using this link👇
https://t.co/FxCjJFsNOG
There are multiple variants in this as well. Some traders use multiple time frame RS.
4/22
RS basically compares returns of one stock/index with the returns of benchmark stock/index at a particular time horizon.
Let's say, I want to analyze TCS and Benchmark Index is Nifty.
5/22


One thing which big player can never hide - VOLUME
preparing mega thread \U0001f9f5 of
— Vikrant (@Trading0secrets) October 18, 2021
#volume analysis .
Key points \U0001f4cd
1\u20e3How should you interpret volume in different time frame?
2\u20e3how do you get that institution or big guys are accumulating ...
The full learning thread \U0001f9f5 about "VOLUME INTERPRETATION "
Stay tuned . \u0964\u0964\u0964\u0964\u0964
Volume price interpretation -
price increases + volume increases = bull 🐂
Price decreases + volume increases = bear 🐻
Price increases + volume decreases = fake upmove) sideways
Price decreases + volume decreases =fake downmove) sideways
1⃣Always big breakout start with big VOLUME.
The higher the volume +higher the range = higher will be the move.
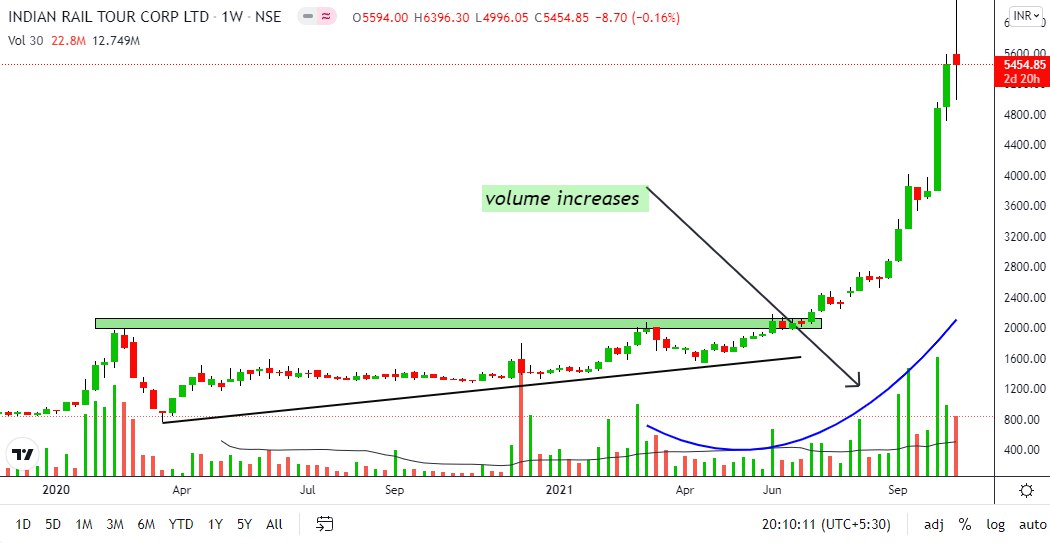
2⃣ IN the time of consolidation volumes are lower then upmove &.
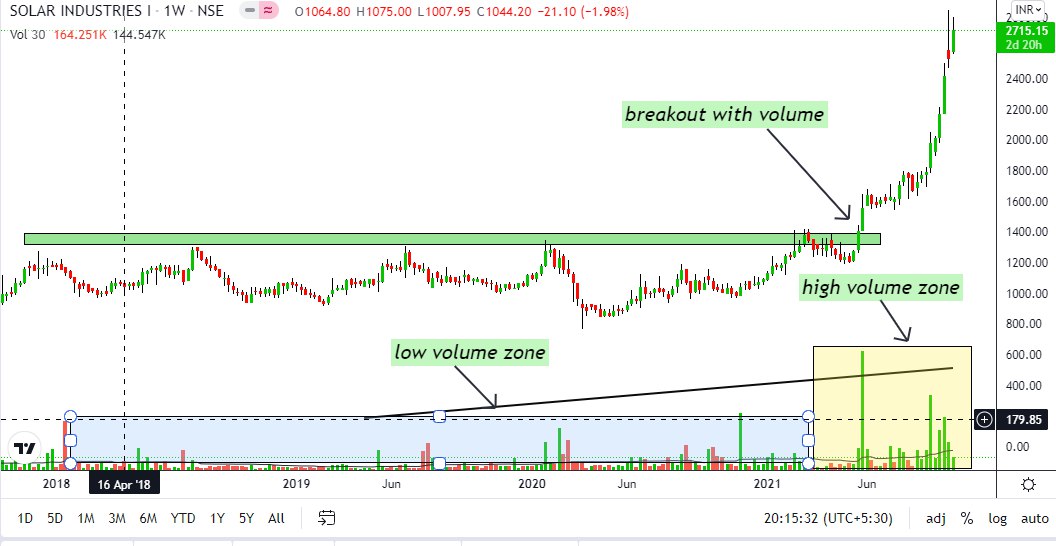
3️⃣ always trend changing move start with big volume action.
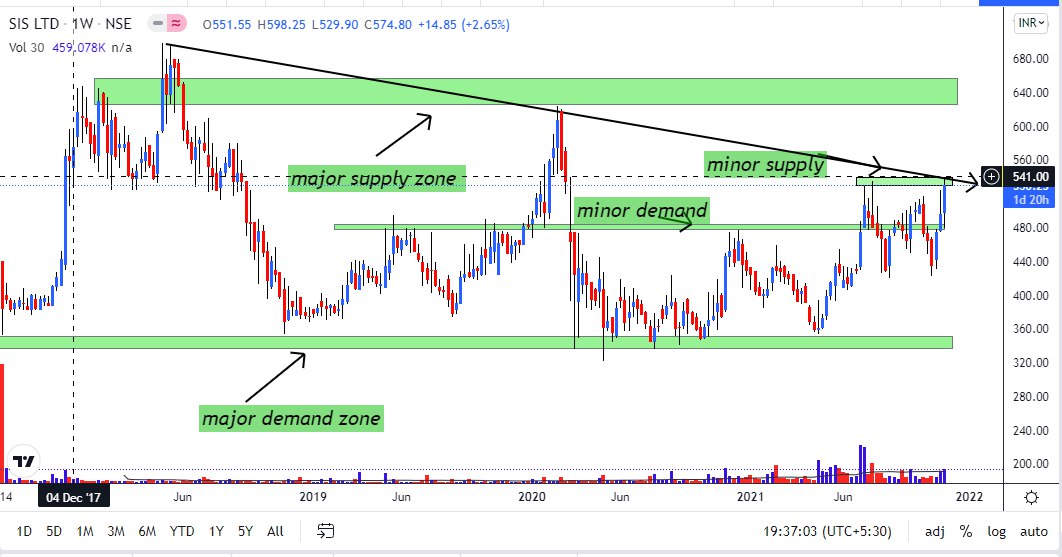
1⃣ #stock selection process - always choose that stock which are consolidating near all time high.
(Because whenever stock will give all time high breakout then it will easily give 20/30% return in 1/2 months
U can use trading view scanner for that.
How I turned 7lac account to 33lac in just 1 year only by cash trading.
— Vikrant (@Trading0secrets) October 14, 2021
Soon going to make full thread about my strategy of cash by which this happened.
And for cash hedging I started option selling in different a/c.
How many of u intrested for that thread? \U0001f499\U0001f49b\U0001f499 pic.twitter.com/wIyfE8fwfw
2⃣volume analysis - In that consolidating period volume should be high of up move days then down move days. And last 3/4 month volume of accumulation is much higher.
3️⃣ fund diversification - always deploy your capital in 3/4 stocks, not more then that or not less then 3.
And, your 3/4 stocks must be from different different sectors.
4⃣comunding magic - If you hold 10 stocks then if 2 stocks will give 100% return then portfolio impact is 20% only. (here time period is 8/15 months)
If you hold 3 stocks out of them 2 will give 40% then ur portfolio impact is 25%
(Here time period is 1/3 months)
5⃣sectors analysis - always choose that sector stocks which are near support or breakout stage.
If any stocks is out of nifty sector then u can open stock scanner website and check their peer charts. If out of 5 , 3 are strong then u can select that company.

Here I will share what I believe are essentials for anybody who is interested in stock markets and the resources to learn them, its from my experience and by no means exhaustive..
First the very basic : The Dow theory, Everybody must have basic understanding of it and must learn to observe High Highs, Higher Lows, Lower Highs and Lowers lows on charts and their
Even those who are more inclined towards fundamental side can also benefit from Dow theory, as it can hint start & end of Bull/Bear runs thereby indication entry and exits.

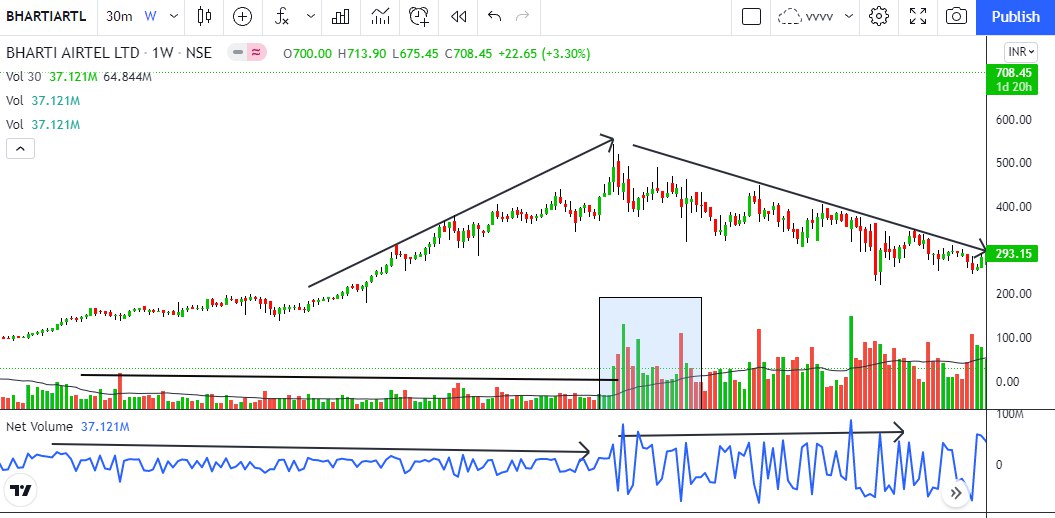
Next basic is Wyckoff's Theory. It tells how accumulation and distribution happens with regularity and how the market actually
Dow theory is old but
Old is Gold....
— Professor (@DillikiBiili) January 23, 2020
this Bharti Airtel chart is a true copy of the Wyckoff Pattern propounded in 1931....... pic.twitter.com/tQ1PNebq7d

Hit the 're-tweet' and help us educated more investors
Yes Bank’s additional Tier 1 bonds, written off. Lakshmi Villas Banks Tier 2 bonds, written off. Understand what & why of ATI and Tier 2 bonds in this thread.
https://t.co/VBmV2dwpPn (1/n)
Yes Bank\u2019s additional Tier 1 bonds, written off. Lakshmi Villas Banks Tier 2 bonds, written off. Understand what & why of ATI and Tier 2 bonds in this thread.
— Kirtan A Shah (@KirtanShahCFP) December 4, 2020
Do \u2018re-tweet\u2019 and help us benefit more investors (1/n)
'Floating Rate Funds' - A case for debt investing in the current interest rate situation
'Floating Rate Funds' - A case for debt investing in the current interest rate situation (A Thread)
— Kirtan A Shah (@KirtanShahCFP) November 27, 2020
You should not miss this if you invest in Debt.
Do \u2018re-tweet\u2019 & help us benefit more investors (1/n)
Fixed Income investment strategies
It’s a misconception that FD, RBI Bond, PPF etc have no risk. The reason we don’t see the risk in them is because for us, risk ONLY means loss of capital.
Fixed Income investment strategies (Thread)
— Kirtan A Shah (@KirtanShahCFP) November 20, 2020
Do 're-tweet' & help us reach & benefit investors
It\u2019s a misconception that FD, RBI Bond, PPF etc have no risk. The reason we don\u2019t see the risk in them is because for us, risk ONLY means loss of capital. (1/n)
Index Funds v/s ETFs
While index funds and ETF’s look similar, there are multiple differences you need to keep in mind before investing in either of them. Let me highlight the important ones
Index Funds v/s ETFs
— Kirtan A Shah (@KirtanShahCFP) November 17, 2020
Do 're-tweet' so that we can reach a larger audience :)
(Thread)
(1) While index funds and ETF\u2019s look similar, there are multiple differences you need to keep in mind before investing in either of them. Let me highlight the important ones (1/n)