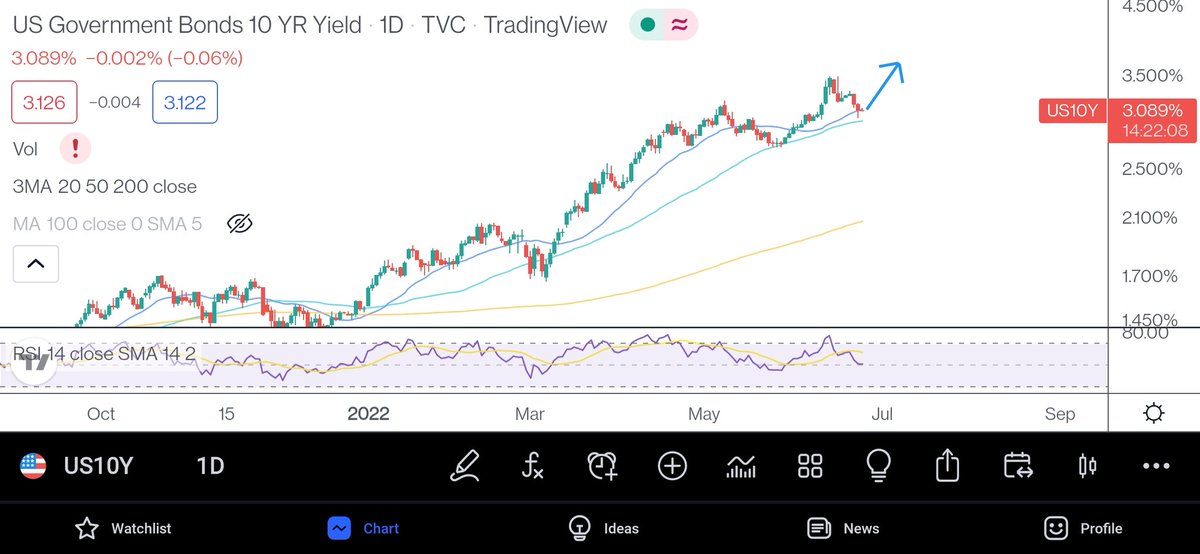
A good possibility for US 10Y to make a new high but a slower one this time and probably should mark the top
#US10Y
More from Aakash Gangwar
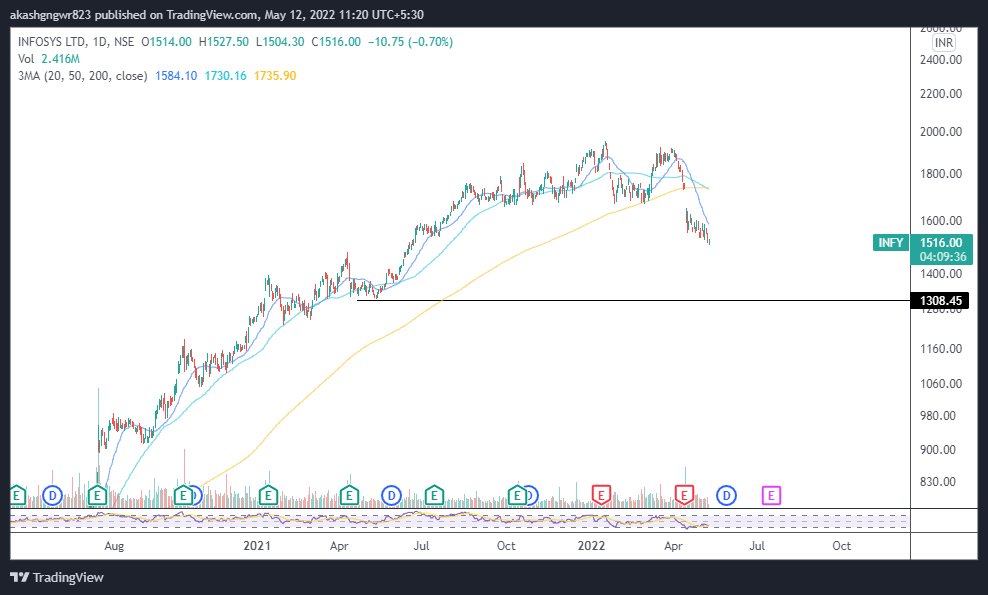
What happened to IEX can happen to CNXIT. Savdhaan rahe, satark rahe. Reiterating it again, every falling wedge/channel, RSI divergence is not a reversal signal.
#CNXIT
#CNXIT
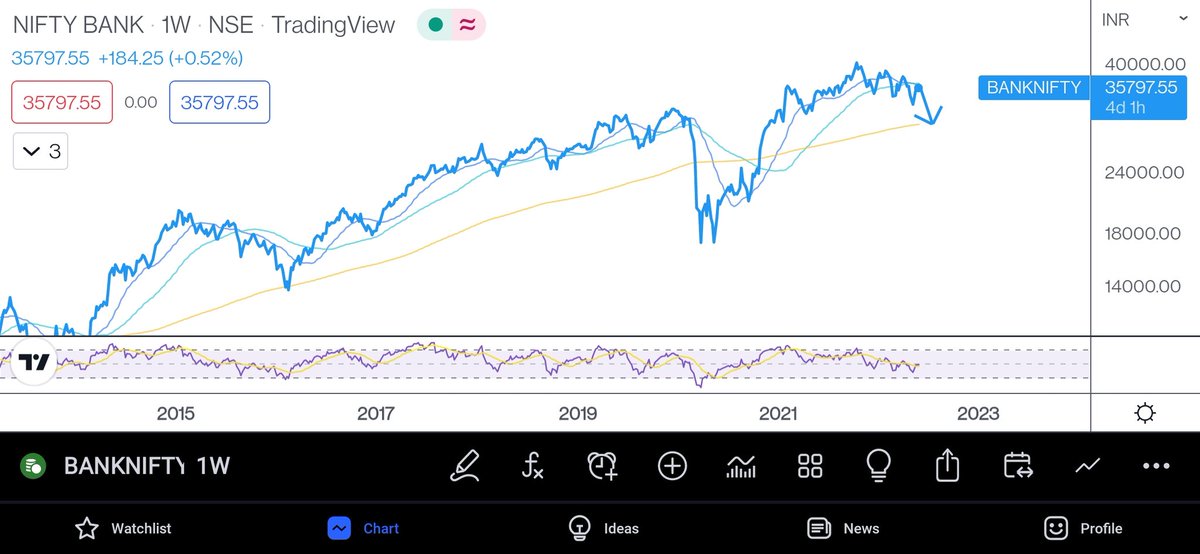
Watching the marked zone to be tested. If it doesn't cross it, then most probably a parabolic downmove towards 24k. That would lead to even large caps cracking just like Small and Midcaps. #CNXIT https://t.co/FxbzP5vlBr pic.twitter.com/FSqcSqTQM9
— Aakash Gangwar (@akashgngwr823) June 21, 2022

You May Also Like

THREAD: 12 Things Everyone Should Know About IQ
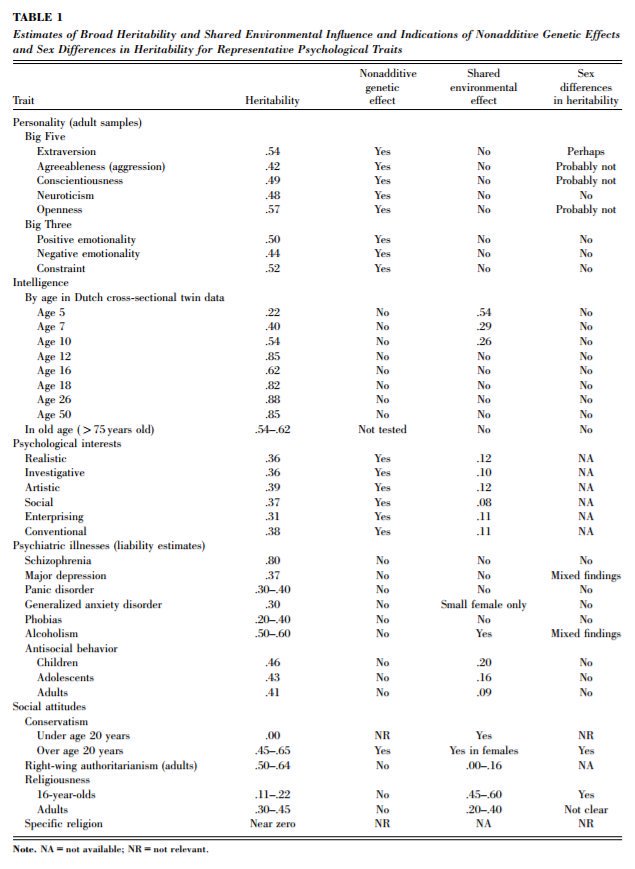
1. IQ is one of the most heritable psychological traits – that is, individual differences in IQ are strongly associated with individual differences in genes (at least in fairly typical modern environments). https://t.co/3XxzW9bxLE
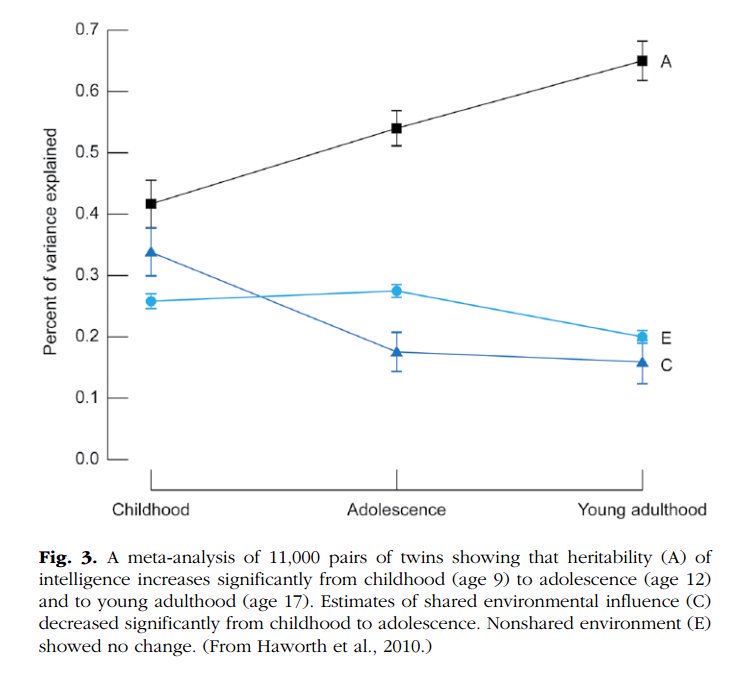
2. The heritability of IQ *increases* from childhood to adulthood. Meanwhile, the effect of the shared environment largely fades away. In other words, when it comes to IQ, nature becomes more important as we get older, nurture less. https://t.co/UqtS1lpw3n
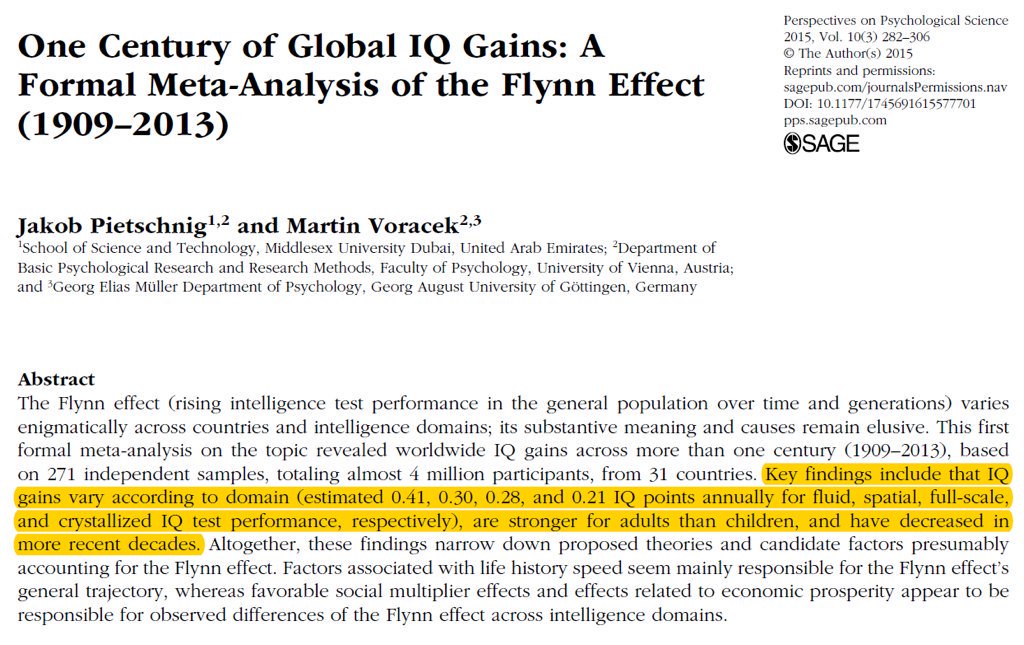
3. IQ scores have been increasing for the last century or so, a phenomenon known as the Flynn effect. https://t.co/sCZvCst3hw (N ≈ 4 million)
(Note that the Flynn effect shows that IQ isn't 100% genetic; it doesn't show that it's 100% environmental.)
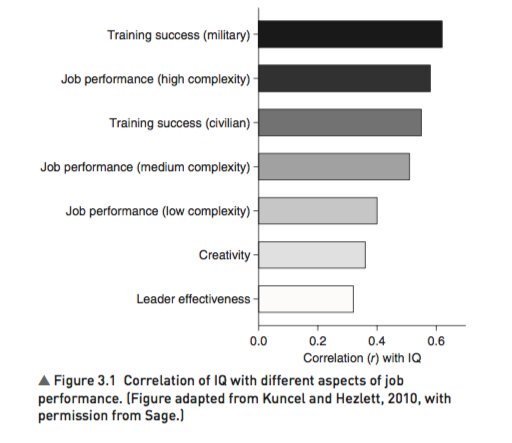
4. IQ predicts many important real world outcomes.
For example, though far from perfect, IQ is the single-best predictor of job performance we have – much better than Emotional Intelligence, the Big Five, Grit, etc. https://t.co/rKUgKDAAVx https://t.co/DWbVI8QSU3
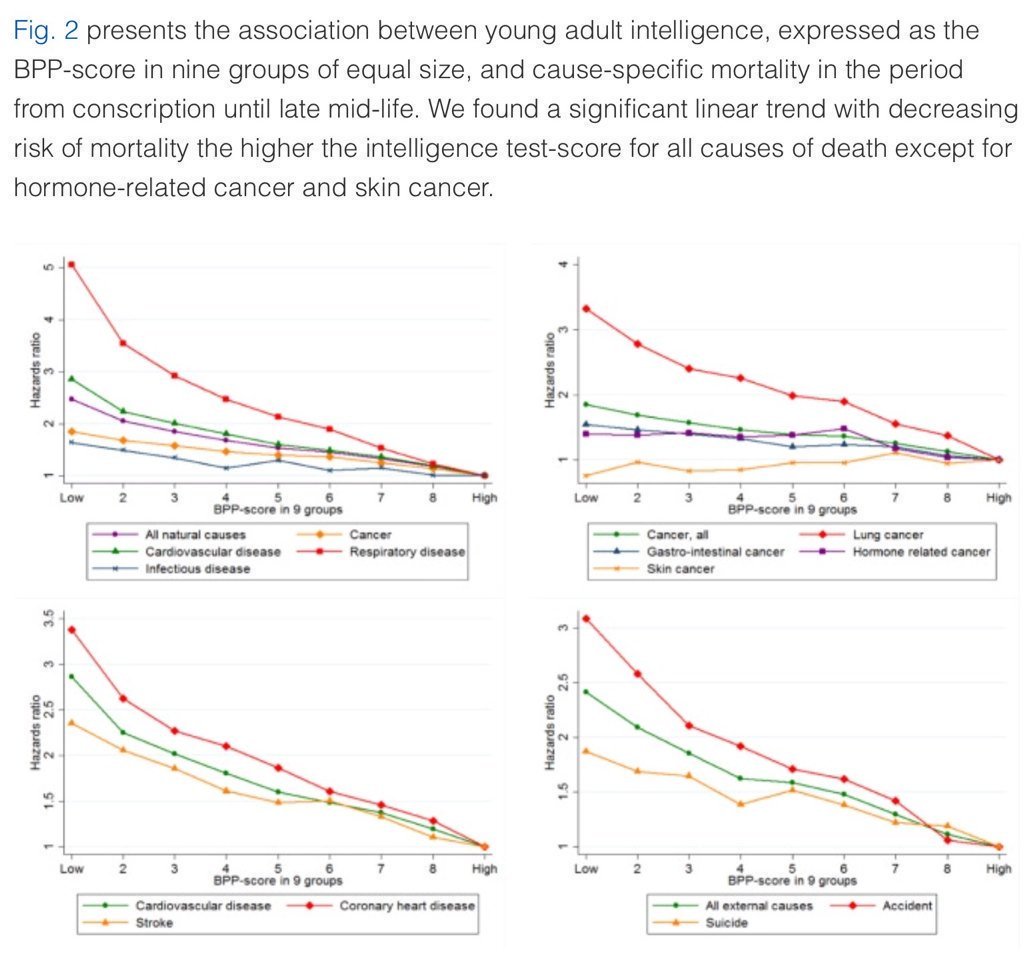
5. Higher IQ is associated with a lower risk of death from most causes, including cardiovascular disease, respiratory disease, most forms of cancer, homicide, suicide, and accident. https://t.co/PJjGNyeQRA (N = 728,160)
1. IQ is one of the most heritable psychological traits – that is, individual differences in IQ are strongly associated with individual differences in genes (at least in fairly typical modern environments). https://t.co/3XxzW9bxLE
2. The heritability of IQ *increases* from childhood to adulthood. Meanwhile, the effect of the shared environment largely fades away. In other words, when it comes to IQ, nature becomes more important as we get older, nurture less. https://t.co/UqtS1lpw3n
3. IQ scores have been increasing for the last century or so, a phenomenon known as the Flynn effect. https://t.co/sCZvCst3hw (N ≈ 4 million)
(Note that the Flynn effect shows that IQ isn't 100% genetic; it doesn't show that it's 100% environmental.)
4. IQ predicts many important real world outcomes.
For example, though far from perfect, IQ is the single-best predictor of job performance we have – much better than Emotional Intelligence, the Big Five, Grit, etc. https://t.co/rKUgKDAAVx https://t.co/DWbVI8QSU3
5. Higher IQ is associated with a lower risk of death from most causes, including cardiovascular disease, respiratory disease, most forms of cancer, homicide, suicide, and accident. https://t.co/PJjGNyeQRA (N = 728,160)

Oh my Goodness!!!
I might have a panic attack due to excitement!!
Read this thread to the end...I just had an epiphany and my mind is blown. Actually, more than blown. More like OBLITERATED! This is the thing! This is the thing that will blow the entire thing out of the water!
Has this man been concealing his true identity?
Is this man a supposed 'dead' Seal Team Six soldier?
Witness protection to be kept safe until the right moment when all will be revealed?!
Who ELSE is alive that may have faked their death/gone into witness protection?

Were "golden tickets" inside the envelopes??

Are these "golden tickets" going to lead to their ultimate undoing?
Review crumbs on the board re: 'gold'.

#SEALTeam6 Trump re-tweeted this.

I might have a panic attack due to excitement!!
Read this thread to the end...I just had an epiphany and my mind is blown. Actually, more than blown. More like OBLITERATED! This is the thing! This is the thing that will blow the entire thing out of the water!
Tik Tok pic.twitter.com/8X3oMxvncP
— Scotty Mar10 (@Allenma15086871) December 29, 2020
Has this man been concealing his true identity?
Is this man a supposed 'dead' Seal Team Six soldier?
Witness protection to be kept safe until the right moment when all will be revealed?!
Who ELSE is alive that may have faked their death/gone into witness protection?
Were "golden tickets" inside the envelopes??
Are these "golden tickets" going to lead to their ultimate undoing?
Review crumbs on the board re: 'gold'.
#SEALTeam6 Trump re-tweeted this.