There are certain indicators, levels, or other ways you can increase your odds of being right >50%, but you'll never get significantly higher
You always hear people let your winners ride or cut your losers early. Easier said than done, right?
Well, it's a mathematical fact that implementing this will improve your trading profits
The math behind leaving runners on and cutting losers early 👇👇👇
There are certain indicators, levels, or other ways you can increase your odds of being right >50%, but you'll never get significantly higher
You HAVE to let your winners run and cut your losers early.
Example: you take 100 trades for $100. Winners win $10, losers lose $10. To profit, you need 51 winners (+$510) and 49 losers (-$490)
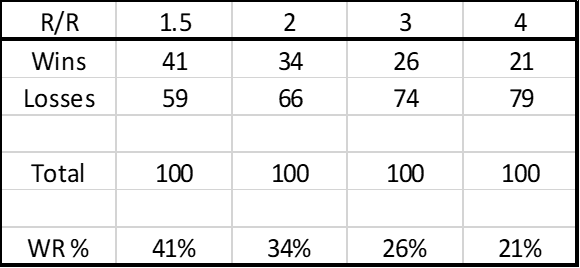
Example: you take 100 trades for $100. Winners win $20, losers lose $5. To profit, you need 21 winners (+$420) and 79 losers (-$395)
You can essentially lose 4 out of every 5 trades and still make money if you simply let your winners run and cut your losers
2:1 (winners run 20%, losers stopped out at 10%), you only need to win 34%
3:1, 26%
4:1, 21%
You decrease the # of trades you need to hit by having your winners outweigh your losers
1) Have a rule on your stop losses. Personally, every trade I enter I immediately set a STOP order for -10%
2) Have a target profit level for winners. For me, I like the 2:1 risk/reward so once a trade hits 20% profits, I start to scale out
So when my trade hits 20%, I scale out part of my position and move my stop order for the rest to 10% profits
Remember, YOU CAN ALWAYS RE-ENTER.
1) Your thesis of it breaking the level is no longer valid
2) If it breaks above the level again, you can just re-enter
Special thanks to @AdamSliverTrade , @notmrmanziel , @TradingWarz , and the rest of the #LDL crew for getting me on this path and helping inform threads like this
More from Tradingthread

A thread of my threads!

1. https://t.co/cWGjheFrdL
2. https://t.co/tgJO7riEYH
3. OFFERINGS
4. OPTIONS and WARRANTS
1. https://t.co/cWGjheFrdL
I\u2019m going to do a thread on \u201cDD\u201d. Due diligence is everything about investing. There\u2019s no wrong way to do DD, but I\u2019m going to show a few things I do in order to finding a company that I believe in. Also mix in what others do as well!
— Yates Investing (@yatesinvesting) May 16, 2020
2. https://t.co/tgJO7riEYH
Tonight I want to discuss \u201cGap Fills\u201d I was asked the other day what I meant, so I decided to do this thread.
— Yates Investing (@yatesinvesting) May 14, 2020
3. OFFERINGS
Alright, so tonight i\u2019m going to discuss offerings. I\u2019m also going to discuss why I think offerings are easy money makers. It\u2019s one of my trading strategies, but don\u2019t think that means you need to go buy every stock that has an offering. This might be long. Let\u2019s get started....
— Yates Investing (@yatesinvesting) May 12, 2020
4. OPTIONS and WARRANTS
Let\u2019s learn the difference between stock options and stock warrants real quick.
— Yates Investing (@yatesinvesting) May 12, 2020
Also want to go over option trading more.



I've compiled a master thread of the top 5 threads I've made in 2021🔥
Here's a complete guide to everything you should know about trading
👇👇👇
Before I dive in, do me a favor and retweet the tweet above this one.
I want everyone to win in 2022, and a like/RT will help someone out there who really needs it🙏
LET'S DIVE IN👇
How to Scan for stocks whose options move over
My EXACT Strategy breakdown in a brief
The Top Tools every trader should
Here's a complete guide to everything you should know about trading
👇👇👇
Before I dive in, do me a favor and retweet the tweet above this one.
I want everyone to win in 2022, and a like/RT will help someone out there who really needs it🙏
LET'S DIVE IN👇
How to Scan for stocks whose options move over
Ever wonder how traders get in stocks before they explode? \U0001f9d0
— FT Trading\u2503Stock Trader (@FT__Trading) October 27, 2021
Or find options that move 1,000% in a single day/week?\U0001f92f
I made a thread going over exactly how I find these stocks BEFORE they take off \U0001f680
\U0001f447\U0001f447\U0001f447
My EXACT Strategy breakdown in a brief
I\u2019m a full time day/swing trader for a living.
— FT Trading\u2503Stock Trader (@FT__Trading) October 20, 2021
I\u2019ve learned a lot through my time trading.
Here\u2019s a thread going over my exact trading strategy
As well as some helpful tips/tricks.
\U0001f447\U0001f447\U0001f447
The Top Tools every trader should
Ever wonder what the best tools for trading are? \U0001f528
— FT Trading\u2503Stock Trader (@FT__Trading) December 28, 2021
Here are the top tools I use as a full-time trader\U0001f9f5
\U0001f447\U0001f447\U0001f447

🚨CRASH COURSE THREAD🚨
Below YOU will find a thread to ALL my #InestrTradesCrashCourse!
Please ❤️Like, 🔁Retweet & ✅Follow if you want more videos!
I Will continue to add content to this as I create more crash courses for you guys!
Tools Used:
@unusual_whales
https://t.co/6HpP0YeJoj
https://t.co/It3cOSqxkj
https://t.co/lc7HAXqXKz
Below YOU will find a thread to ALL my #InestrTradesCrashCourse!
Please ❤️Like, 🔁Retweet & ✅Follow if you want more videos!
I Will continue to add content to this as I create more crash courses for you guys!
Tools Used:
@unusual_whales
https://t.co/6HpP0YeJoj
\U0001f6a8SWING TRADE CRASH COURSE\U0001f6a8
— InvestrTrades (@InvestrTrades) November 13, 2021
Beginners Guide to Swing Trading
\u2705How to find setups
\u2705How to use @unusual_whales to build conviction
\u2705Which Options Strike to Choose
Please \u2764\ufe0fLike, \U0001f501Retweet & \u2705Follow if you want more videos!
https://t.co/It3cOSqxkj
\U0001f6a8OPTIONS CRASH COURSE\U0001f6a8
— InvestrTrades (@InvestrTrades) October 30, 2021
Beginners Guide to Options + Trading Options With Unusual Whales & How!!
So Many of you have been asking about the basics of options so you can use @unusual_whales for day/swing trading.
Please \u2764\ufe0fLike, \U0001f501Retweet & \u2705Follow if you want more videos!
https://t.co/lc7HAXqXKz
\U0001f6a8OPTIONS CRASH COURSE PART 2\U0001f6a8
— InvestrTrades (@InvestrTrades) November 20, 2021
We will discuss
\u2705Day Trade? Swing Trade?
\u2705What Strike/Exp To Choose
\u2705How to Put in Options Order
\u2705How to use @unusual_whales to Get Conviction
\u2705When All Combined. Choose Strike/Exp
Please \u2764\ufe0fLike, \U0001f501Retweet & \u2705Follow if you want more videos!
You May Also Like


Great article from @AsheSchow. I lived thru the 'Satanic Panic' of the 1980's/early 1990's asking myself "Has eveyrbody lost their GODDAMN MINDS?!"
The 3 big things that made the 1980's/early 1990's surreal for me.
1) Satanic Panic - satanism in the day cares ahhhh!
2) "Repressed memory" syndrome
3) Facilitated Communication [FC]
All 3 led to massive abuse.
"Therapists" -and I use the term to describe these quacks loosely - would hypnotize people & convince they they were 'reliving' past memories of Mom & Dad killing babies in Satanic rituals in the basement while they were growing up.
Other 'therapists' would badger kids until they invented stories about watching alligators eat babies dropped into a lake from a hot air balloon. Kids would deny anything happened for hours until the therapist 'broke through' and 'found' the 'truth'.
FC was a movement that started with the claim severely handicapped individuals were able to 'type' legible sentences & communicate if a 'helper' guided their hands over a keyboard.
For three years I have wanted to write an article on moral panics. I have collected anecdotes and similarities between today\u2019s moral panic and those of the past - particularly the Satanic Panic of the 80s.
— Ashe Schow (@AsheSchow) September 29, 2018
This is my finished product: https://t.co/otcM1uuUDk
The 3 big things that made the 1980's/early 1990's surreal for me.
1) Satanic Panic - satanism in the day cares ahhhh!
2) "Repressed memory" syndrome
3) Facilitated Communication [FC]
All 3 led to massive abuse.
"Therapists" -and I use the term to describe these quacks loosely - would hypnotize people & convince they they were 'reliving' past memories of Mom & Dad killing babies in Satanic rituals in the basement while they were growing up.
Other 'therapists' would badger kids until they invented stories about watching alligators eat babies dropped into a lake from a hot air balloon. Kids would deny anything happened for hours until the therapist 'broke through' and 'found' the 'truth'.
FC was a movement that started with the claim severely handicapped individuals were able to 'type' legible sentences & communicate if a 'helper' guided their hands over a keyboard.