So I'll give you a breakdown on which website I use to check my DD along with mainly using my PLATFORM as the MAIN source of information. But other websites are also used. . Then I will provide you with a youtuber whose name is RILEY ..
https://t.co/1f8wQs1LcA
Really liking this website it has breakdown of the financials & summary of SEC filings. (con'd)
10-K & 10-Q.
Read 8Ks ..company updates
Also look to see if they did an recent Offerings (S-4 filings)
Also look to see S-3 filings for upcoming dilutions.
cont'd
https://t.co/KsYqlmTlQ8 for quick news info
https://t.co/v5xGZqWhbn For constant world news
Riley here has some great lessons for swing trades as well. You may wish to dive into his content and learn at your own pace.
Youtube is amazing .. it has content that we never wished was possible 20 years ago. The education is in our palms now
More from Tradingthread




My threads, data, tools I use, investment philosophy and frequently asked questions. Please review these links.
1. Overview
https://t.co/p2gjgPvhHG
2. Investing Process
https://t.co/ZpJeN0JiSV
3. Tools I use and
4. Market Analysis https://t.co/Ol9POhXMiV
5. Due diligence and deep dives on stocks
https://t.co/0oTNNsXuwr
6. General
7. My ongoing
8. List of about 20+ email newsletters in investing / technology and self help that I would
9. I do a lot of writing about IPOs and like to research new companies.
You can follow my writing and subscribe (Free) at
1. Overview
https://t.co/p2gjgPvhHG
2. Investing Process
https://t.co/ZpJeN0JiSV
3. Tools I use and
4. Market Analysis https://t.co/Ol9POhXMiV
5. Due diligence and deep dives on stocks
https://t.co/0oTNNsXuwr
6. General
7. My ongoing
8. List of about 20+ email newsletters in investing / technology and self help that I would
9. I do a lot of writing about IPOs and like to research new companies.
You can follow my writing and subscribe (Free) at


Due Diligence Thread 🚨👇
In this thread I will be revealing to you guys my step by step process on how I do my due diligence on any ticker along with the process of how I find good setups and what resources and websites do I use to do it.
Step 1: Finding Good Chart Setups (continued)
Attached below is my personal finviz screener settings which I use to look at charts and how I
change some of the settings to my own preferences.
Site Reference: https://t.co/liI2ktnHhz
PS: Sometimes I don't even select any pattern
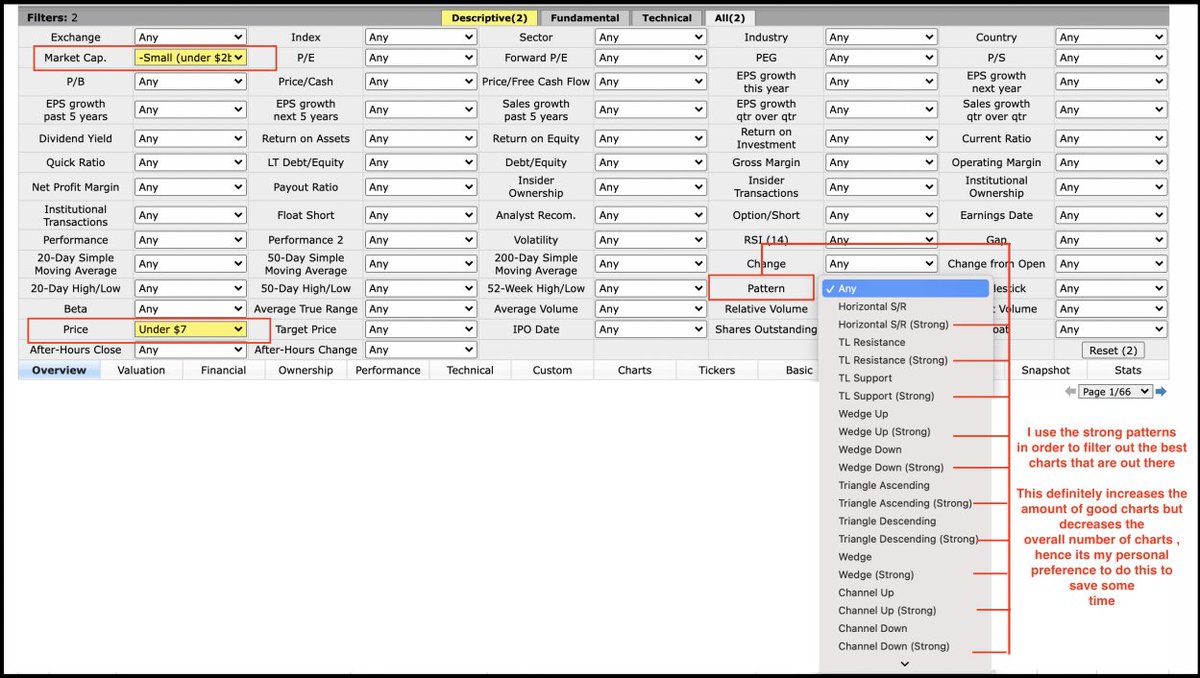
My favorite bullish chart setups that I personally look out for initiating swing positions:
1-) Falling Wedge Pattern
2-) Ascending Triangle Pattern
3-) Fish Hook / Oversold Bounce Pattern
4-) Channel Up Pattern
5-) Descending Triangle Breakout Pattern ( Towards Upside)
Step 2: Checking for Offerings
Once I have found a good chart, with a high risk reward ratio, the immediate first thing that I
do is to look out for any signs of upcoming offering. Since I don’t want to get caught in
offerings , these are the two things that I lookout for.
Step 2: Checking for Offerings (continued)
1-) Firstly, I look for whether the company had made any recent offerings in the last two months, if yes then there are less chances of new offerings.
In this thread I will be revealing to you guys my step by step process on how I do my due diligence on any ticker along with the process of how I find good setups and what resources and websites do I use to do it.
Step 1: Finding Good Chart Setups (continued)
Attached below is my personal finviz screener settings which I use to look at charts and how I
change some of the settings to my own preferences.
Site Reference: https://t.co/liI2ktnHhz
PS: Sometimes I don't even select any pattern
My favorite bullish chart setups that I personally look out for initiating swing positions:
1-) Falling Wedge Pattern
2-) Ascending Triangle Pattern
3-) Fish Hook / Oversold Bounce Pattern
4-) Channel Up Pattern
5-) Descending Triangle Breakout Pattern ( Towards Upside)
Step 2: Checking for Offerings
Once I have found a good chart, with a high risk reward ratio, the immediate first thing that I
do is to look out for any signs of upcoming offering. Since I don’t want to get caught in
offerings , these are the two things that I lookout for.
Step 2: Checking for Offerings (continued)
1-) Firstly, I look for whether the company had made any recent offerings in the last two months, if yes then there are less chances of new offerings.
You May Also Like


I'm going to do two history threads on Ethiopia, one on its ancient history, one on its modern story (1800 to today). 🇪🇹
I'll begin with the ancient history ... and it goes way back. Because modern humans - and before that, the ancestors of humans - almost certainly originated in Ethiopia. 🇪🇹 (sub-thread):
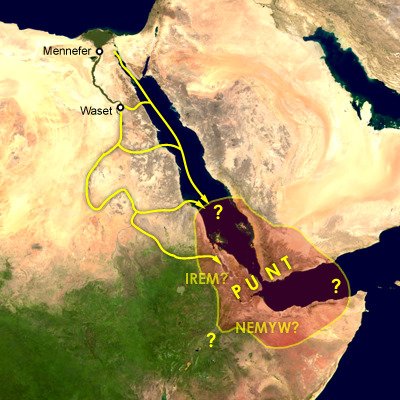
The first likely historical reference to Ethiopia is ancient Egyptian records of trade expeditions to the "Land of Punt" in search of gold, ebony, ivory, incense, and wild animals, starting in c 2500 BC 🇪🇹
Ethiopians themselves believe that the Queen of Sheba, who visited Israel's King Solomon in the Bible (c 950 BC), came from Ethiopia (not Yemen, as others believe). Here she is meeting Solomon in a stain-glassed window in Addis Ababa's Holy Trinity Church. 🇪🇹
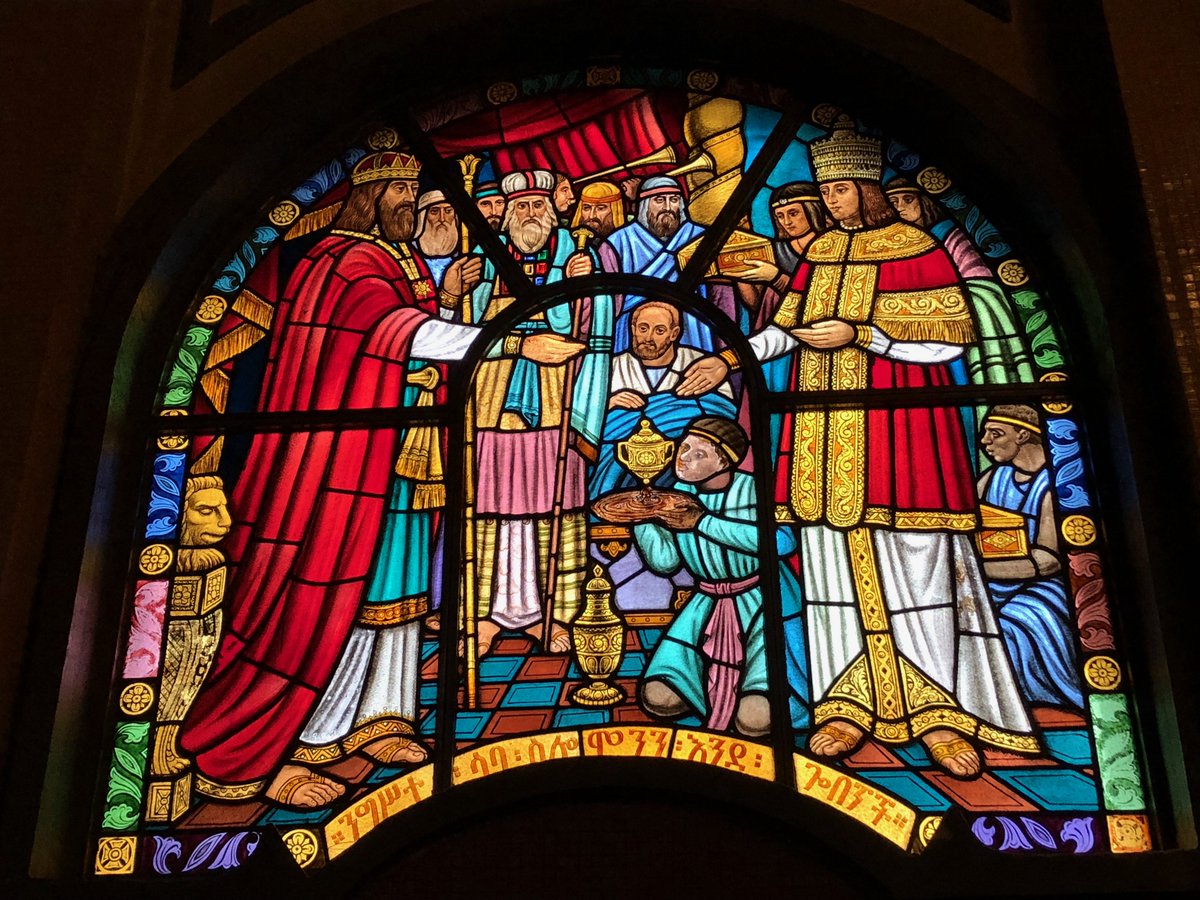
References to the Queen of Sheba are everywhere in Ethiopia. The national airline's frequent flier miles are even called "ShebaMiles". 🇪🇹

I'll begin with the ancient history ... and it goes way back. Because modern humans - and before that, the ancestors of humans - almost certainly originated in Ethiopia. 🇪🇹 (sub-thread):
The famous \u201cLucy\u201d, an early ancestor of modern humans (Australopithecus) that lived 3.2 million years ago, and was discovered in 1974 in Ethiopia, displayed in the national museum in Addis Ababa \U0001f1ea\U0001f1f9 pic.twitter.com/N3oWqk1SW2
— Patrick Chovanec (@prchovanec) November 9, 2018
The first likely historical reference to Ethiopia is ancient Egyptian records of trade expeditions to the "Land of Punt" in search of gold, ebony, ivory, incense, and wild animals, starting in c 2500 BC 🇪🇹
Ethiopians themselves believe that the Queen of Sheba, who visited Israel's King Solomon in the Bible (c 950 BC), came from Ethiopia (not Yemen, as others believe). Here she is meeting Solomon in a stain-glassed window in Addis Ababa's Holy Trinity Church. 🇪🇹
References to the Queen of Sheba are everywhere in Ethiopia. The national airline's frequent flier miles are even called "ShebaMiles". 🇪🇹

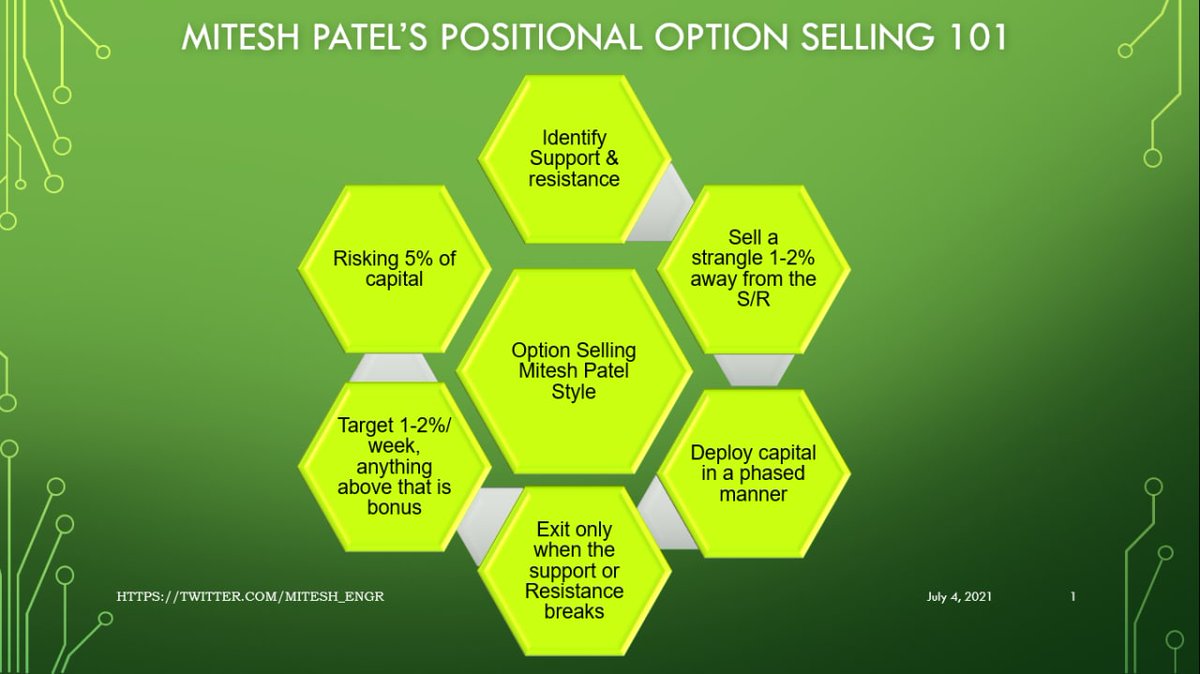
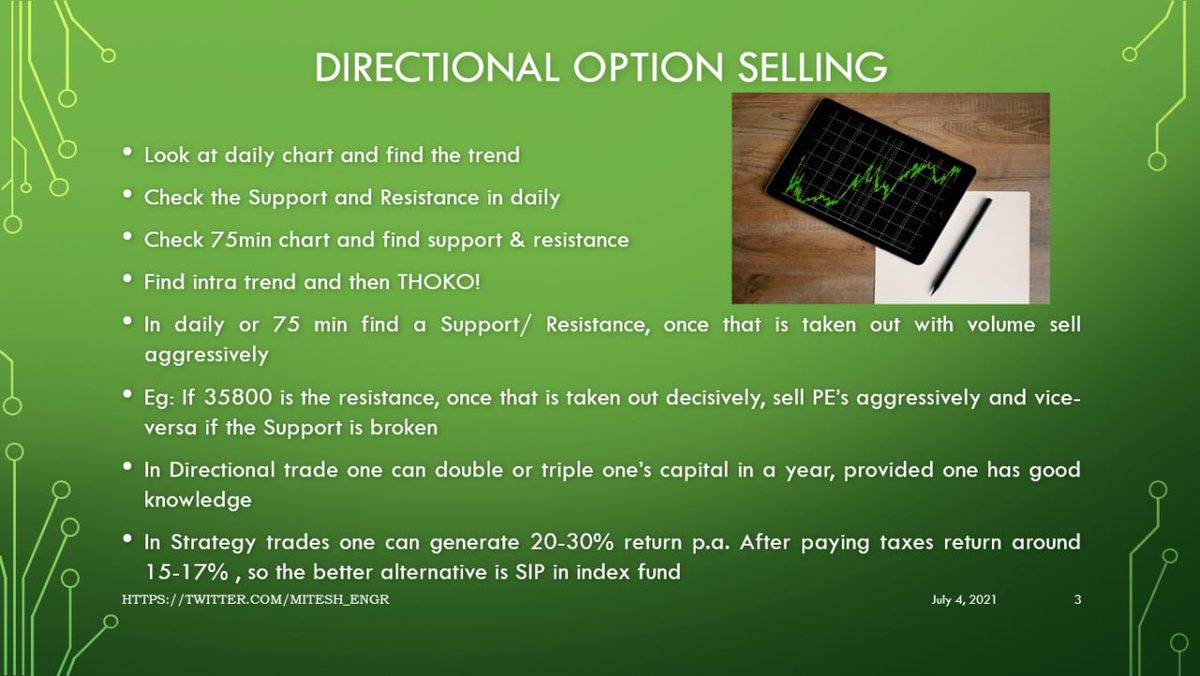
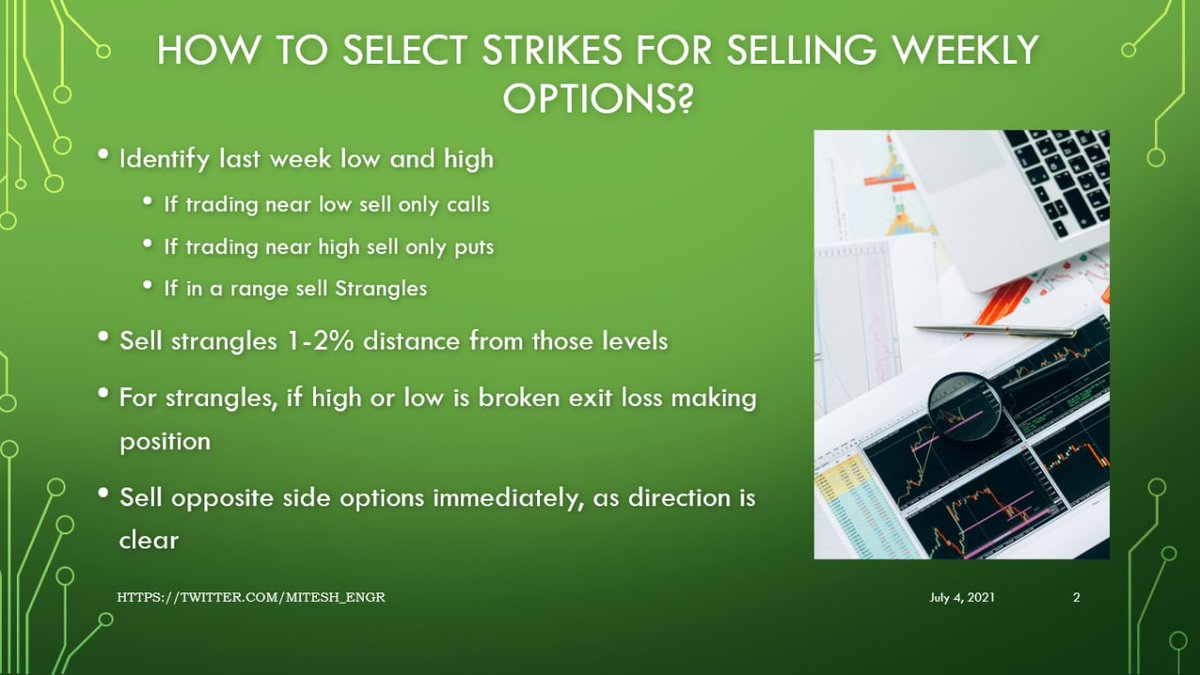
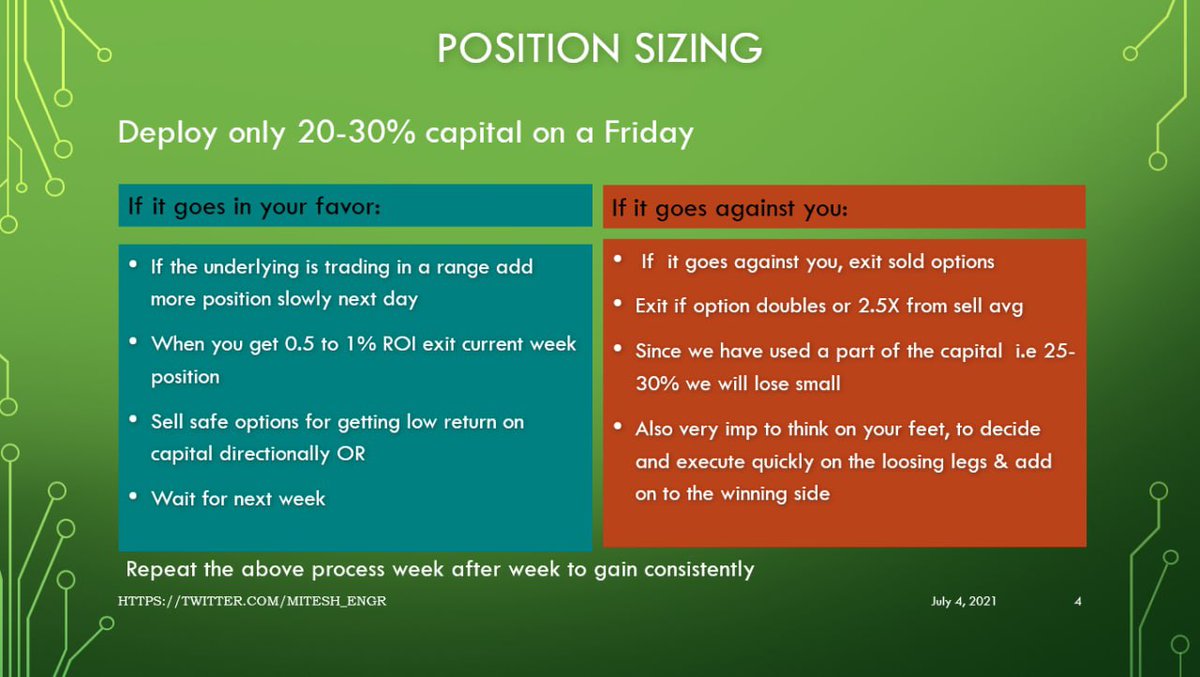
A THREAD ON @SarangSood
Decoded his way of analysis/logics for everyone to easily understand.
Have covered:
1. Analysis of volatility, how to foresee/signs.
2. Workbook
3. When to sell options
4. Diff category of days
5. How movement of option prices tell us what will happen
1. Keeps following volatility super closely.
Makes 7-8 different strategies to give him a sense of what's going on.
Whichever gives highest profit he trades in.
2. Theta falls when market moves.
Falls where market is headed towards not on our original position.
3. If you're an options seller then sell only when volatility is dropping, there is a high probability of you making the right trade and getting profit as a result
He believes in a market operator, if market mover sells volatility Sarang Sir joins him.
4. Theta decay vs Fall in vega
Sell when Vega is falling rather than for theta decay. You won't be trapped and higher probability of making profit.
Decoded his way of analysis/logics for everyone to easily understand.
Have covered:
1. Analysis of volatility, how to foresee/signs.
2. Workbook
3. When to sell options
4. Diff category of days
5. How movement of option prices tell us what will happen
1. Keeps following volatility super closely.
Makes 7-8 different strategies to give him a sense of what's going on.
Whichever gives highest profit he trades in.
I am quite different from your style. I follow the market's volatility very closely. I have mock positions in 7-8 different strategies which allows me to stay connected. Whichever gives best profit is usually the one i trade in.
— Sarang Sood (@SarangSood) August 13, 2019
2. Theta falls when market moves.
Falls where market is headed towards not on our original position.
Anilji most of the time these days Theta only falls when market moves. So the Theta actually falls where market has moved to, not where our position was in the first place. By shifting we can come close to capturing the Theta fall but not always.
— Sarang Sood (@SarangSood) June 24, 2019
3. If you're an options seller then sell only when volatility is dropping, there is a high probability of you making the right trade and getting profit as a result
He believes in a market operator, if market mover sells volatility Sarang Sir joins him.
This week has been great so far. The main aim is to be in the right side of the volatility, rest the market will reward.
— Sarang Sood (@SarangSood) July 3, 2019
4. Theta decay vs Fall in vega
Sell when Vega is falling rather than for theta decay. You won't be trapped and higher probability of making profit.
There is a difference between theta decay & fall in vega. Decay is certain but there is no guaranteed profit as delta moves can increase cost. Fall in vega on the other hand is backed by a powerful force that sells options and gives handsome returns. Our job is to identify them.
— Sarang Sood (@SarangSood) February 12, 2020