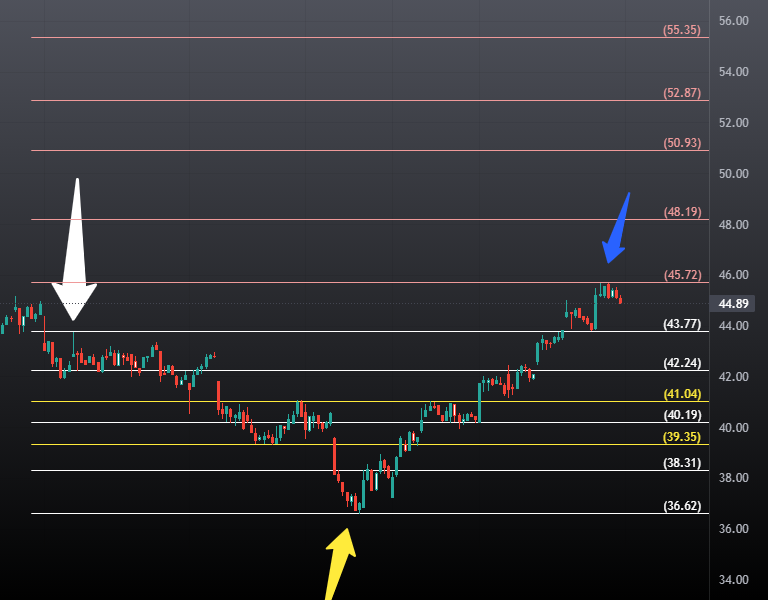
Measure the rise of price from swing low to swing high (depends on the time frame in use)
This level will give the support levels AND the potential resistances levels once price continue higher


\U0001f6a8SWING TRADE CRASH COURSE\U0001f6a8
— InvestrTrades (@InvestrTrades) November 13, 2021
Beginners Guide to Swing Trading
\u2705How to find setups
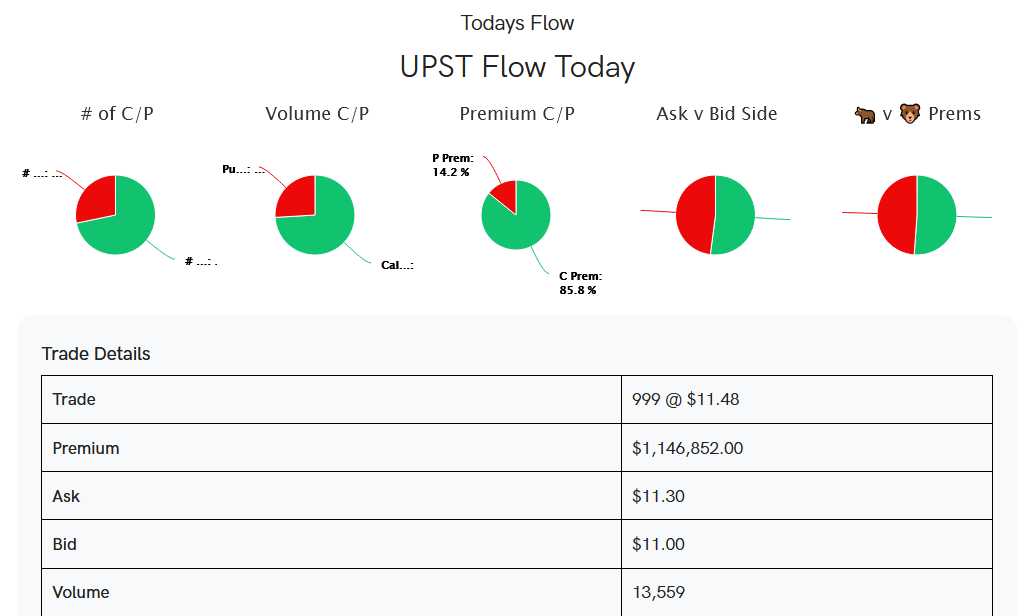
\u2705How to use @unusual_whales to build conviction
\u2705Which Options Strike to Choose
Please \u2764\ufe0fLike, \U0001f501Retweet & \u2705Follow if you want more videos!
\U0001f6a8OPTIONS CRASH COURSE\U0001f6a8
— InvestrTrades (@InvestrTrades) October 30, 2021
Beginners Guide to Options + Trading Options With Unusual Whales & How!!
So Many of you have been asking about the basics of options so you can use @unusual_whales for day/swing trading.
Please \u2764\ufe0fLike, \U0001f501Retweet & \u2705Follow if you want more videos!
\U0001f6a8OPTIONS CRASH COURSE PART 2\U0001f6a8
— InvestrTrades (@InvestrTrades) November 20, 2021
We will discuss
\u2705Day Trade? Swing Trade?
\u2705What Strike/Exp To Choose
\u2705How to Put in Options Order
\u2705How to use @unusual_whales to Get Conviction
\u2705When All Combined. Choose Strike/Exp
Please \u2764\ufe0fLike, \U0001f501Retweet & \u2705Follow if you want more videos!
**16 Must Read Stock Market Books**
— Chris Perruna (@cperruna) November 20, 2019
Gifts for the Holidays!
Reminiscences of a Stock Operator
by Edwin Lef\xe8vrehttps://t.co/DozMNFmvZI pic.twitter.com/b6wEhzMp8n
Trading Lessons for total beginners.
— making sales \uea00 (@making_sales) February 3, 2021
Thanks to @ripster47, @Brady_Atlas @MullinsMomentum, @SDHILLON97, @MrZackMorris, @PJ_Matlock, @notoriousalerts, @Hugh_Henne, @bear_fuker, @Trogdaddy, @atrhodes00 and many more for teaching me all that I know about the stocks.
[THREAD]
If you\u2019re in the process of blowing up your account\u2026
— making sales \uea00 (@making_sales) February 26, 2021
STOP AND READ THIS NOW!
[THREAD]
Stop losses are your friend.
— making sales \uea00 (@making_sales) February 26, 2021
Stop losses help you to follow your rules and respect your plan.
Stop losses help keep the size of your losses minimal and recoverable.
Personally, I recommend using a hard stop loss (especially if you\u2019re new) instead of having a mental one.
People often ask me what is meant by \u201chave your own plan.\u201d
— making sales \uea00 (@making_sales) March 7, 2021
What does a plan consist of and how do you go about creating one?
That\u2019s what I\u2019m here to discuss\u2026
[THREAD]