William's Alligator is probably the most underrated indicator in moving average category.
Alligator follows the premise that market is sideways for 70% of the time and trending only 30% of the time.
This is where William's Alligator can be a great tool for traders.
Why William's Alligator can be a great tool for traders?
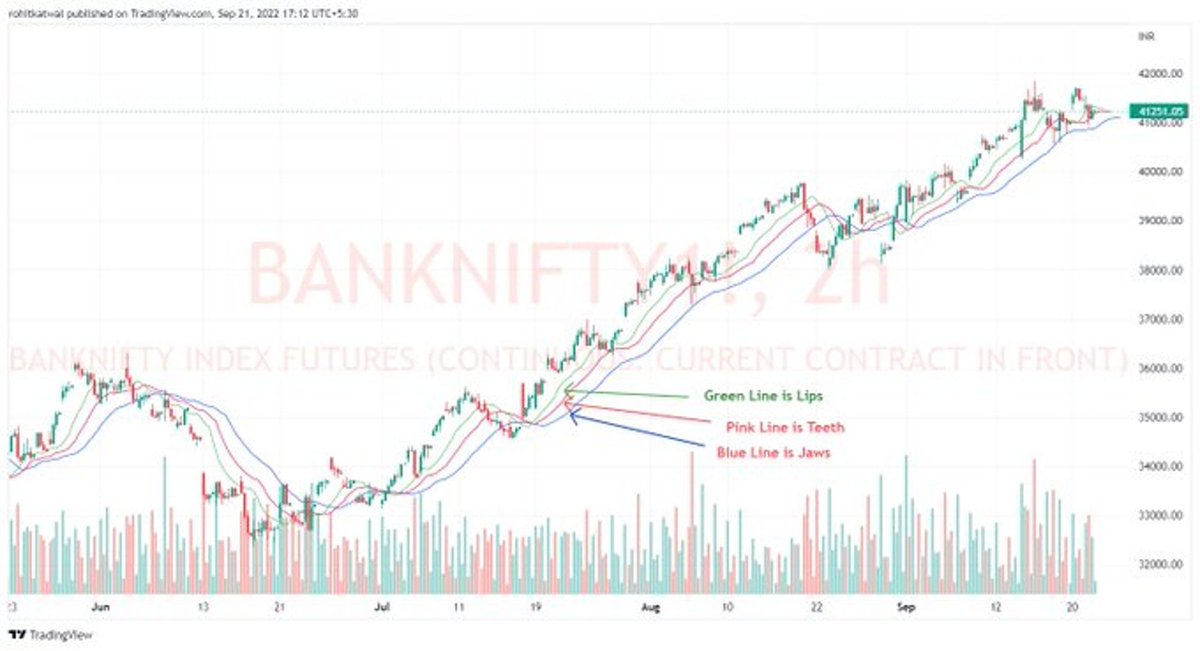
It can identify Bullish, Bearish and Sideways market pretty easily. Problem is, traders don't know how to use it effectively. Alligator has three lines:
1. Lips - Fastest Line
2. Teeth
3. Jaws - Slowest Line
Book Interpretation is when Lips Crosses above Jaws, it's a buying opportunity and when below its a shorting opportunity. And when three lines are crisscrossing, instrument is sideways.
BUT this does not make it a tradeable indicator in practice. Here is what should be done.
Firstly, when all the Alligator lines are moving up or down and are widening, this phase is called "Alligator eating with its mouth wide open". When the lines are crisscrossing, this indicates the alligator is sated.
Now, how to use it? with Basic TA and Indicator like MACD
Rules to remember:
1. As long as price is above Alligator, BANKNIFTY is bullish.
2. As long as MACD is trading above 0 line, BANKNIFTY is bullish.
3. Horizontal Lines are the only S&R.
4. CONGESTION is followed by TREND is followed by CONGESTION.