1/

Get a cup of Bru coffee.

Today I will help you understand a simple implied growth calculator to find a stock buy level. Let's get started.

(A short thread)

2/

As you might know, The value of a stock is the present value of its lifetime cash flows.

For the long term buy and hold investor, the real cash flow from the stock is dividend income over its lifetime.
3/

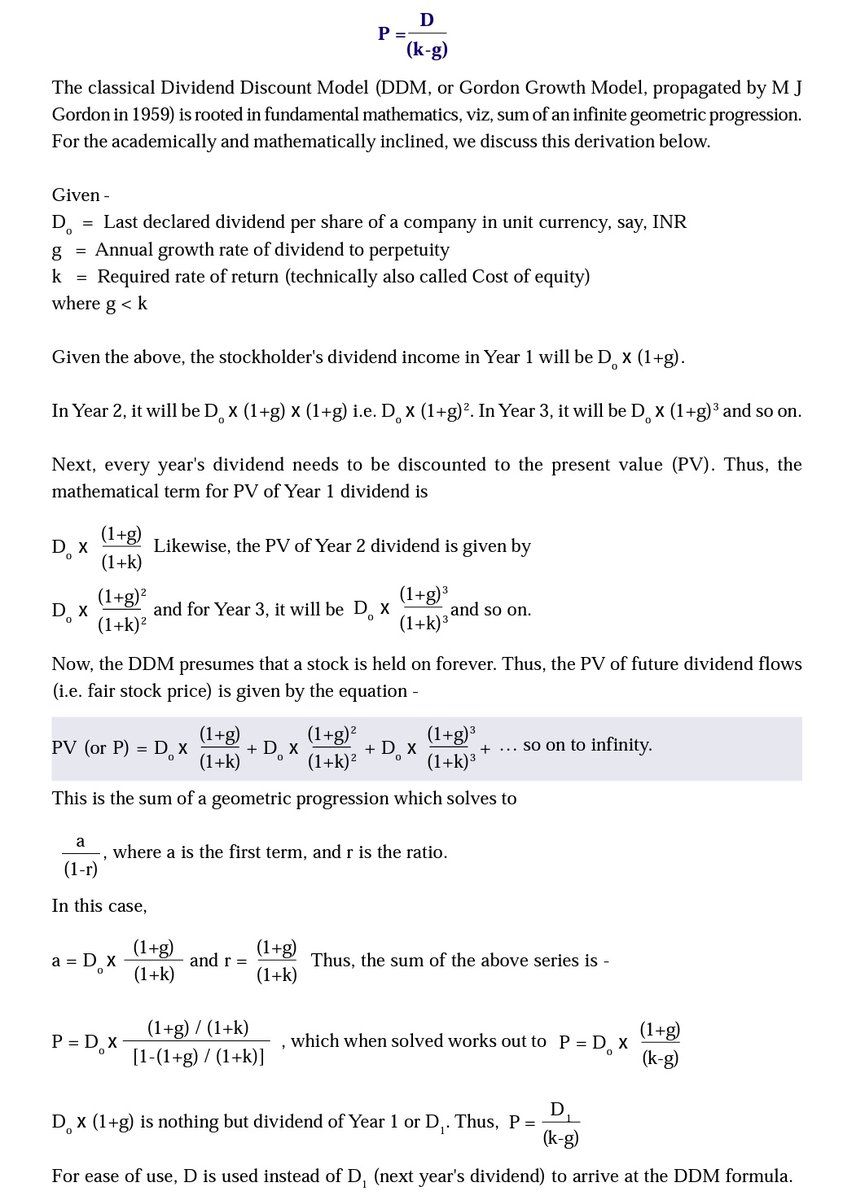
In 1959, M J Gordon proposed a formula for this. The formula is

Value = D/(r-g)

Whereas

D = Expected dividends.
r = Required rate of return.
g = Dividend growth rate in perpetuity.

A detailed derivation of the formula is given at the end.
4/

Now, let's be honest, it is next to impossible to predict the growth rate in perpetuity for a firm.

So we twist the formula a little bit. Rather than finding out value, we find the *implied growth rate* This helps us to make deals with Mr. Market.
5/

Here is some math:

Value = D/(r-g)

r-g = D/value

D/value is nothing but dividend yield, so we substitute the same.

r-g = Dividend yield

g = r-Dividend yield

*Implied growth = Required rate of return - Dividend yield*
6/

Since we got implied growth formula, we can use it in some real-life firms.

Let's take Hind Unilever as a case study. The stock is trading at 83 x of FY 20 earnings. A traditional PE investor right away calls it overvalued.
7/

However, taking an r of 10% and a dividend yield of around 1%, the implied growth comes at 9% in perpetuity.

You have to make a bet here. If you think that the firm dividends grow at that rate forever, you buy or else you avoid.
8/

Let's take another example ITC Ltd. Assuming an r of 10% and a dividend yield of 5%, the implied growth comes at 5%.

Whereas the long-term dividend growth rate for ITC Ltd is 13%. So it looks like the stock is undervalued for some reason.
9/

Also, not all firms pay dividends. So you can use free cash flow in place of dividends.

And take an average number to reduce outlier risk.

Do note that r is not some magical number. So feel free to use your own required rate of return.
10/

Here is the maths behind the Gordon growth model.

Thank you for reading. Enjoy your weekend.

The End.

More from Trading

12 TRADING SETUPS used by professional traders:🧵

Collaborated with @niki_poojary

Here's what you'll learn in this thread:

1. Capture Overnight Theta Decay
2. Trading Opening Range Breakouts
3. Reversal Trading Setups
4. Selling strangles and straddles in Bank Nifty
6. NR4 + IB
7. NR 21-Vwap Strategy

Let's dive in ↓

1/ STBT option Selling (Positional Setup):

The setup uses price action to sell options for overnight theta decay.

Check Bank Nifty at 3:15 everyday.

Sell directional credit spreads with capped


@jigspatel1988 2/ Selling Strangles in Bank Nifty based on Open Interest Data

Don't trade till 9:45 Am.

Identify the highest OI on puts and calls.

Check combined premium and put a stop on individual


@jigspatel1988 3/ Open Drive (Intraday)

This is an opening range breakout setup with a few conditions.

To be used when the market opens above yesterday's day high

or Below yesterday's day's

You May Also Like